Kano
Statistical/Analytical Method
Kano Analysis is a framework that categorizes product features based on how their presence or absence affects customer satisfaction. The method uses paired functional and dysfunctional questions to determine how customers react to each feature.
Respondents answer two questions for each feature:
- Functional question (K1): “How would you feel if a product had [FEATURE]?”
- Dysfunctional question (K2): “How would you feel if a product did not have [FEATURE]?”
By cross-tabulating responses to these paired questions using the Kano evaluation matrix, features are classified into five categories:
- Must-have (Basic/Hygiene): Expected features where absence causes dissatisfaction, but presence doesn’t increase satisfaction
- Performance (Linear): Features where satisfaction increases proportionally with quality/presence
- Attractive (Delighters): Unexpected features that create delight when present but don’t cause dissatisfaction when absent
- Indifferent: Features customers don’t care about either way
- Reverse: Features that actually decrease satisfaction when present
Problem It Solves
Kano Analysis solves the strategic challenge of feature investment prioritization when resources are limited. It helps organizations:
- Distinguish between features that are expected versus those that create competitive advantage
- Avoid investing in features customers are indifferent about
- Identify unexpected delighters that can differentiate the product
- Understand which features are table stakes versus value-adds
- Make data-driven decisions about product roadmaps and development priorities
Key Assumptions
- Customer awareness: Respondents can conceptualize and evaluate features they may not have experienced, and can accurately predict their emotional response to feature presence/absence
- Independent features: Features are distinct and non-overlapping; respondents evaluate each independently
- Stable preferences: Customer preferences for features remain relatively stable during the study period, though subgroup differences may exist
- Survey comprehension: Respondents understand the dual-question format and can differentiate between functional and dysfunctional scenarios
Business Questions This Answers
Kano Analysis is ideal for answering:
- Feature prioritization: “Which features should we invest in first for maximum customer satisfaction impact?”
- Product roadmap decisions: “What should be in our MVP versus future releases?”
- Competitive positioning: “Which features will differentiate us versus which are expected by the market?”
- Investment allocation: “Where should we allocate our limited development resources?”
- Customer satisfaction drivers: “What actually drives satisfaction versus what customers simply expect?”
- Market segmentation: “Do different customer segments value features differently?”
When NOT to Use
Kano Analysis is inappropriate when:
- Features are interdependent: If features cannot be evaluated independently or have complex interactions
- Insufficient sample size: When you cannot achieve minimum 100 respondents overall or 50+ per subgroup
- Immediate tactical decisions: When decisions need to be made faster than a 2-3 week study allows
- Technical feasibility unknown: When the organization hasn’t validated whether features are technically or financially viable to implement
- Highly dynamic markets: In rapidly changing markets where feature preferences shift quickly (results may be outdated before implementation)
- Established products with known preferences: When customer preferences are already well-understood through existing data
- Features are too abstract: When features cannot be described concretely enough for customers to evaluate
Alternative approaches:
- MaxDiff for relative preference ranking without satisfaction dimensions
- Conjoint analysis for understanding feature trade-offs and willingness to pay
- A/B testing for validating actual behavior with implemented features
- Customer interviews for exploratory feature discovery
Data Requirements
Sample Requirements:
- Overall analysis: Minimum 100 respondents
- Subgroup analysis: Minimum 50 respondents per subgroup
- Insufficient samples lead to unreliable categorizations and low confidence in recommendations
Feature Requirements:
- Maximum 15 features (use least-fill rotation if more needed, though this reduces analysis base per feature)
- Each feature must be:
- Well-defined and specific
- At the same granularity level as other features
- Non-overlapping with other features
- Actionable (client can actually implement/control it)
- Measurable
Data Quality Requirements:
- Clean responses with error checking for logical contradictions
- Randomized feature presentation order
- Sufficient cognitive engagement (minimum hold times on screens)
- Validated comprehension of the task format
Survey Infrastructure:
- Platform capable of:
- Question randomization
- Minimum screen hold times
- Error checking logic
- Least-fill rotation (if needed)
Time Allocation
| Stage | Hours |
|---|---|
| Kick-off & planning | 2 |
| Questionnaire design | 2 |
| Analysis - overall | 8 |
| Analysis - per subgroup | 2 |
| Total (overall + 2 subgroups) | 16 hours |
Note: Add 2 hours per additional subgroup for analysis
Key Milestones (Analytics Perspective)
- Analytics Briefing: Initial project briefing with stakeholders to understand objectives and feature requirements
- Questionnaire Review: Review and validation of questionnaire design, feature definitions, and survey logic
- Interim Data Provided: Preliminary data delivered for initial quality checks and validation
- Analytics Set Up Outputs: Output templates and analysis frameworks prepared and configured
- Final Data Provided: Complete dataset delivered with all quality checks passed
- Analytics Run Final Outputs: Final analysis executed, categorizations completed, and outputs generated
- Debrief Attended by Analytics (if necessary): Analytics team available for findings presentation and Q&A session
Questionnaire
Sample Size Calculations
Minimum Requirements:
- Overall analysis: 100+ respondents for reliable feature categorization
- Subgroup analysis: 50+ respondents per subgroup minimum
Rule of thumb: For each feature, aim for at least 10-15 respondents per category to achieve stable categorization patterns.
Considerations for Subgroup Analysis:
- If using least-fill rotation (15+ features), effective base size per feature is reduced
- Plan for 20-30% oversample to account for potential data quality issues
- Budget for screening costs if targeting specific audiences
Example Question Structure
Task Introduction:
In the next section, we'll ask about several features that a [PRODUCT/SERVICE] might have.

For each feature, you'll answer TWO questions:
1. How you'd feel if the feature WAS included
2. How you'd feel if the feature WAS NOT included

Please read each feature carefully and consider both questions thoughtfully.
[Hold screen for 10+ seconds with “Continue” button]
Feature Preview Screen:
Here are the features we'll be asking about:

• [Feature 1]
• [Feature 2]
• [Feature 3]
...
[Hold screen for 10+ seconds]
Question Pair for Each Feature (randomized order):
Screen 1 - Functional Question (K1):
Feature: [FEATURE DESCRIPTION DISPLAYED AT TOP]

If this [product/service] had [FEATURE], how would you feel?

○ I'd love it (1)
○ I expect it to be offered (2)
○ I don't mind either way (3)
○ I would prefer it not to be offered, but can live with it (4)
○ This would annoy me (5)
[Minimum 5-second hold before allowing progression]
Screen 2 - Dysfunctional Question (K2):
Feature: [FEATURE DESCRIPTION DISPLAYED AT TOP]

If this [product/service] did NOT have [FEATURE], how would you feel?

○ I would much prefer it not to be offered (1)
○ I don't expect it to be offered (2)
○ I don't mind either way (3)
○ I would prefer if it was offered, but can live without it (4)
○ It would annoy me if it wasn't offered (5)
[Minimum 5-second hold before allowing progression]
Error Checking Logic:
Flag obvious contradictions for review: - If K1 = 5 (annoyed by presence) AND K2 = 5 (annoyed by absence) - If K1 = 1 (love presence) AND K2 = 1 (prefer absence) - If K1 = 2 (expect presence) AND K2 = 2 (don’t expect presence)
Error Message (if triggered):
"Please review your answers to ensure they accurately reflect your feelings about this feature."[Allow revision or confirmation to proceed]
Customization Examples:
For betting apps: > “How would you feel if an online betting brand had [FEATURE]?” > “How would you feel if an online betting brand did NOT have [FEATURE]?”
For pet products: > “If a dry food dog brand had [FEATURE], how would you feel?” > “If a dry food dog brand did NOT have [FEATURE], how would you feel?”
For consumer electronics: > “If a laptop bag had [FEATURE], how would you feel?” > “If a laptop bag did NOT have [FEATURE], how would you feel?”
Key Features and Considerations
Survey Design Best Practices:
Non-Negotiable Elements:
- ✅ Clear task introduction explaining the dual-question format
- ✅ Feature preview screen held for 10+ seconds
- ✅ Randomized feature order to eliminate order effects
- ✅ Feature statement displayed at top of each question screen
- ✅ Minimum 5-second hold per screen before allowing progression
- ✅ Error checking for logical contradictions
Optional Enhancements:
- Least-fill rotation for 15+ features (distributes respondent load)
- Progress indicator to reduce dropout
- Attention checks for longer surveys (15+ features)
- Validation questions to ensure comprehension
Feature Definition Quality:
| ❌ Poor Definition | ✅ Improved Definition |
|---|---|
| “Good to look at” | “5+ color options to choose from” |
| “Easy to use” | “One-click checkout process” |
| “Good customer service” | “24/7 live chat support” |
| “Reliable” | “99.9% uptime guarantee with service credits” |
| “Fast delivery” | “Same-day delivery for orders placed before 2pm” |
Kano Classification Matrix
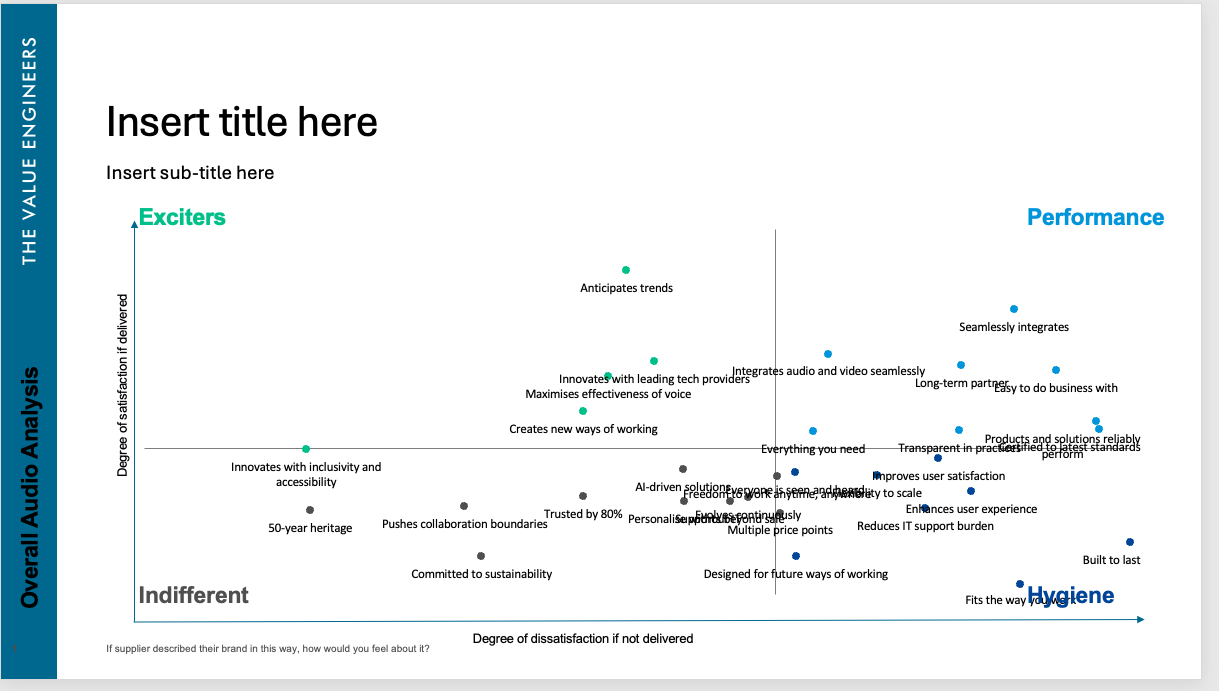
This Kano classification matrix visualizes how different product features impact customer satisfaction. Features are plotted across four key categories:
- Exciters (top-left): Unexpected features that delight customers when present but don’t cause dissatisfaction when absent
- Performance (top-right): Features where satisfaction increases linearly with quality - critical for competitive differentiation
- Hygiene (bottom-right): Expected features that cause dissatisfaction when absent but don’t increase satisfaction when present
- Indifferent (bottom-left): Features customers don’t care about either way
The x-axis represents the degree of dissatisfaction if the feature is not delivered, while the y-axis shows the degree of satisfaction if delivered. This visualization enables strategic prioritization by identifying which features to invest in, which are table stakes, and which provide differentiation opportunities.
Additional Output Types
Kano Analysis typically includes:
- Satisfaction Coefficient: A net of the positive and negative responses to determine overall satisfaction impact
- Kano classification tables: Feature-by-feature breakdown with categorization percentages
- Subgroup Comparison Tables: Category and satisfaction coefficients net differences across customer segments
Previous Project Examples
Project 1: Nestle - Eastern Paws Kano Analysis
Academic Papers and Textbooks
Foundational Work:
- Kano, N., Seraku, N., Takahashi, F., & Tsuji, S. (1984). “Attractive Quality and Must-be Quality.” Journal of the Japanese Society for Quality Control, 14(2), 39-48.
- Original paper introducing the Kano model
Methodological Guidance:
- Berger, C., Blauth, R., Boger, D., et al. (1993). “Kano’s Methods for Understanding Customer-Defined Quality.” Center for Quality Management Journal, 2(4), 3-36.
- Comprehensive guide to Kano methodology and analysis techniques
- Matzler, K., & Hinterhuber, H. H. (1998). “How to Make Product Development Projects More Successful by Integrating Kano’s Model of Customer Satisfaction into Quality Function Deployment.” Technovation, 18(1), 25-38.
- Integration of Kano analysis with QFD for product development
Extensions and Applications:
- Löfgren, M., & Witell, L. (2008). “Two Decades of Using Kano’s Theory of Attractive Quality: A Literature Review.” The Quality Management Journal, 15(1), 59-75.
- Comprehensive literature review of Kano applications across industries
- Chen, K. J., & Yeh, T. M. (2013). “Application of Improved Kano Model to Identify Service Elements for Services Industry.” African Journal of Business Management, 7(34), 3478-3487.
- Application to service industries with methodological refinements
Statistical Analysis:
- Lee, M. C., & Newcomb, J. F. (1997). “Applying the Kano Methodology to Meet Customer Requirements: NASA’s Microgravity Science Program.” Quality Management Journal, 4(3), 95-110.
- Statistical approaches to Kano categorization and validation
R Package Documentation:
- tveKano package documentation (internal)
- TVE’s proprietary R package for Kano analysis automation and visualization
Ready to use Kano Analysis in your project? Contact the analytics team to discuss your requirements and next steps.
Email: Analytics@dtadvisorygroup.com
What to prepare for our discussion:
- List of potential features to evaluate (we’ll help refine them)
- Target audience definition and expected sample size
- Desired subgroup analyses
- Decision timeline and implementation roadmap
- Budget parameters