Path Analysis
Statistical/Analytical Method
Path Analysis is a structured way to understand how different attitudes, perceptions, and experiences influence one another in sequence.
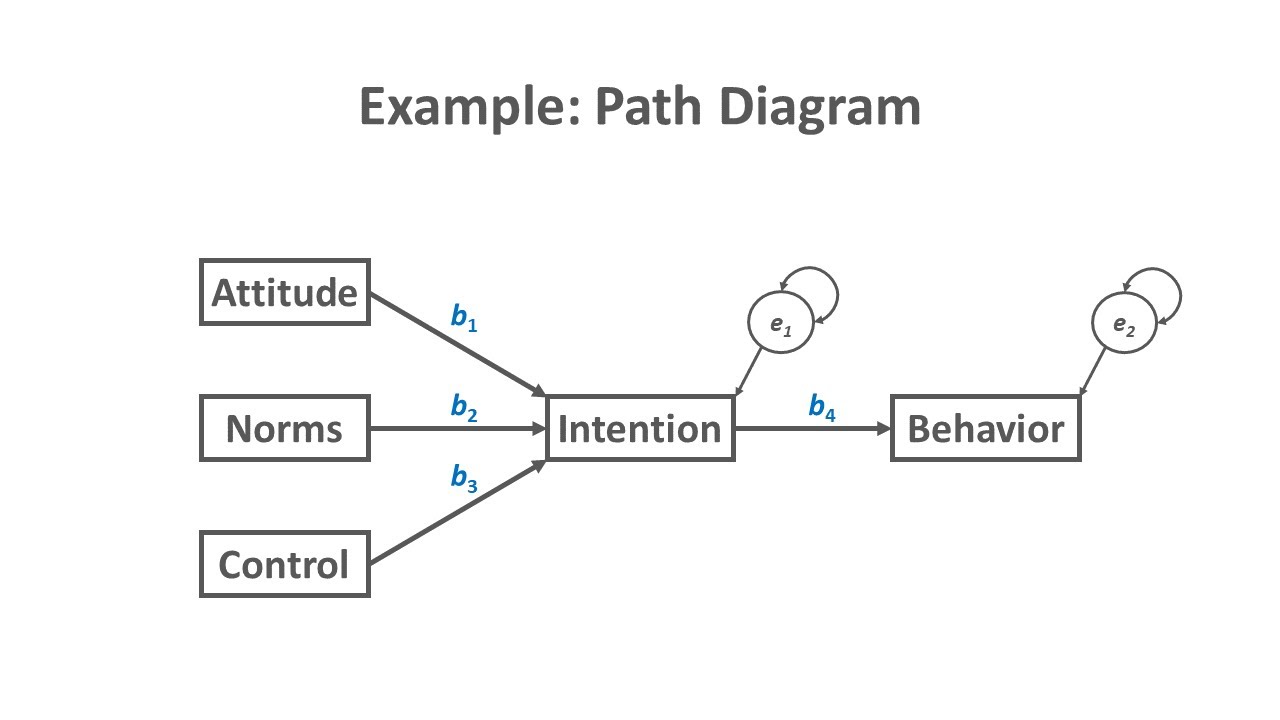
It comes from behavioral science, where researchers observed that people rarely jump straight from a perception to a behavior. Instead:
Perceptions → shape Intentions → which drive Behaviors
Path Analysis formalizes this logic by breaking a complex outcome into steps. It allows us to quantify:
- Direct effects: one factor influencing another immediately
- Indirect effects: influence that works through a middle step
- Total effects: the combined downstream impact across the chain
This makes Path Analysis especially useful when we believe outcomes unfold over time or through stages — for example, when experience shapes satisfaction, and satisfaction shapes choices.
Although it uses structural equation modeling (SEM) beneath the surface, the practical goal is simple: map out the chain of influence from early perceptions to final outcomes.
Problem It Solves
Most business outcomes don’t happen all at once. They follow a psychological or experiential journey.
Examples include:
- Shopper experience → confidence → purchase decision
- Brand perceptions → consideration → preference
- In-store cues → satisfaction → future loyalty
Path Analysis helps solve the classic challenge:
“We can measure many things — but how do they actually lead to the final outcome?”
It untangles complex systems by:
- Showing which levers matter early in the journey
- Quantifying how much impact comes indirectly through key stages
- Revealing why improving one metric leads to a lift in others
In other words, Path Analysis doesn’t just tell you what is associated with the outcome — it explains how the outcome comes to be.
Key Assumptions
For Path Analysis to produce clear, meaningful insights, a few conceptual assumptions should hold:
- There is a logical order to the variables
(e.g., perceptions come before intentions; intentions before behaviors) - The mediator is real and meaningful, not just another correlated metric
- Each question measures a distinct concept (e.g., satisfaction vs. usefulness)
- Changes in earlier variables are expected to influence later ones
These assumptions come from decades of behavioral and social science research, and the analytics team evaluates them carefully before running the model.
Business Questions This Answers
Path Analysis is ideal for understanding the sequence behind key business outcomes.
It helps answer strategic questions such as:
- What perceptions or experiences trigger the downstream outcomes we care about?
- Which stages of the consumer journey act as “bottlenecks” or pivotal transition points?
- How much of the final outcome is driven indirectly through satisfaction, trust, or intention?
- Where should we focus efforts if we want to strengthen the entire pathway?
It is particularly valuable when:
- Outcomes depend on a chain of psychological steps
- Teams want to understand why something influences behavior, not just whether it does
- We need to show the mechanics of influence, not just a correlation
Path Analysis turns scattered metrics into a coherent behavioral story.
When NOT to Use
Path Analysis may not be a good fit when:
- The order of variables is unclear or debatable
- The sample size is too small to support multi-step modeling
- Variables are highly redundant or measure the same idea
- The main objective is pure prediction rather than explanation
In these cases, simpler regressions or key driver techniques may be more appropriate.
Data Requirements
Path Analysis works best when the underlying data reflects a clear sequence of attitudes, intentions, and behaviors. To ensure the model can accurately estimate both direct and indirect effects, a few data conditions help:
Data Type:
Survey data that includes at least one outcome (e.g., satisfaction, intent, sentiment, behavior) and a set of predictors that logically precede it (e.g., brand perceptions, in-store experiences, expectations, attitudes).Structure:
Continuous, ordinal, or categorical variables are all acceptable.
The analytics team will choose the appropriate modeling approach depending on scale type (e.g., Likert, yes/no, rating scales).Sample Size:
Ideally several hundred respondents or more, especially when there are multiple mediators or many predictors.
Larger samples help the model distinguish subtle indirect effects and support stable estimates.Question Design:
Inputs should capture distinct, interpretable concepts that follow a logical behavioral order—such as perceptions → intentions → behaviors.
Questions that are redundant, ambiguous, or misaligned with the hypothesized pathway make the model harder to interpret.Conceptual Flow:
Variables should naturally fit into “early,” “middle,” and “late” stages of the consumer or shopper journey.
Path Analysis performs best when the survey is built with this flow in mind.
Time Allocation
| Stage | Hours |
|---|---|
| Kick-off & planning | 2 |
| Questionnaire design | 2 |
| Analysis - overall | 8 |
| Analysis - per subgroup | 2 |
| Total (overall + 2 subgroups) | 16 hours |
Note: Add 2 hours per additional subgroup for analysis
Key Milestones (Analytics Perspective)
- Analytics Briefing: Initial project briefing with stakeholders to understand objectives and feature requirements
- Questionnaire Review: Review and validation of questionnaire design, feature definitions, and survey logic
- Interim Data Provided: Preliminary data delivered for initial quality checks and validation
- Analytics Set Up Outputs: Output templates and analysis frameworks prepared and configured
- Final Data Provided: Complete dataset delivered with all quality checks passed
- Analytics Run Final Outputs: Final analysis executed, categorizations completed, and outputs generated
- Debrief Attended by Analytics (if necessary): Analytics team available for findings presentation and Q&A session
Questionnaire
Sample Size Calculations
Overall analysis
Path Analysis generally benefits from at least a few hundred respondents to support modeling multiple linked paths.Subgroups
If you need subgroup insights (e.g., markets, segments), each subgroup should ideally have 100+ respondents for stable comparisons.Model complexity
More complex pathways (multiple mediators, many predictors) require larger samples. Simpler pathways can work with smaller samples if the conceptual model is tight.Practical guideline
As a rule of thumb, having 15–20 respondents per key variable in the model is a helpful starting point, but the analytics team will advise based on the final design.
Example Question Structure
Because Path Analysis is built around how people move from one stage to another, surveys for this method typically include three types of variables:
Outcome variables (final stage)
What we ultimately care about explaining
(e.g., purchase intent, satisfaction, likelihood to recommend).Mediator variables (middle stage)
The “bridge” concepts that carry influence from perceptions to outcomes
(e.g., trust, consideration, confidence, satisfaction).Predictor variables (early stage)
The perceptions, experiences, or exposures that start the chain
(e.g., quality impressions, ease of use, service experience, value).
Path Analysis doesn’t require a single question format, but it does require that each question clearly represents a stage or driver in the overall journey.
Path Analysis is flexible:
- ordinal (Likert)
- binary
- categorical
- continuous numeric variables
All work well. Continuous variables often make relationships easier to detect because they contain more variation.
Example Survey for Path Analysis
(1 Outcome • 1 Mediator • 4 Drivers)
This survey aims to understand how early perceptions during the buying journey shape a key mediating attitude, which in turn influences a final outcome (e.g., purchase likelihood). Path Analysis will help quantify both direct and indirect effects.
Thank you for taking part in this survey.
Your responses will help us understand how your perceptions and experiences influence your buying decisions. All answers are confidential.
Q1. Purchase Likelihood
How likely are you to choose [Brand/Retailer] the next time you shop in this category?
- 0 = Not at all likely
- 10 = Extremely likely
Q2. Consideration Intention
How much do you intend to consider [Brand/Retailer] on your next shopping trip?
- Not at all
- Slightly
- Moderately
- Very
- Extremely
These represent the four “starting point” perceptions or exposures that lead into the mediator.
Q3. Quality Perception (Rating Scale)
How strongly do you agree that [Brand/Retailer] offers high-quality products or services?
- Strongly disagree
- Disagree
- Neutral
- Agree
- Strongly agree
Q4. Ease of Shopping (Semantic Differential)
Please rate [Brand/Retailer] on the following scale:
- Difficult ⟶ Easy (1–7)
Q5. Value for Money (Rating Scale)
How would you rate the value for money offered by [Brand/Retailer]?
- 1 = Very poor value
- 5 = Excellent value
Q6. Recent Exposure to Brand Touchpoints (Binary)
Did you notice any in-store displays, signage, or online promotions for [Brand/Retailer] during your most recent shopping journey?
- Yes
- No
(Not used in the core path model, but allowed as supplemental context if desired.)
Q7. Number of Times You Shopped the Category in the Past Month
(Numeric open field)
1. Objective
Use Path Analysis to quantify how the four early drivers influence the mediator (Consideration Intention), and how the mediator influences the outcome (Purchase Likelihood).
2. Model Structure
- Drivers → Mediator
- Quality Perception
- Ease of Shopping
- Value for Money
- Brand Exposure (Yes/No)
- Quality Perception
- Mediator → Outcome
- Consideration Intention → Purchase Likelihood
- Optional: Direct effects from drivers → outcome may be included if the team wants to test partial mediation.
3. Outputs
Direct effects
Influence from each driver → mediator
Influence from mediator → outcomeIndirect effects
Each driver’s effect on the outcome through the mediatorTotal effects
Combined direct + indirect influence
4. Insights Expected
- Identify which early-stage perceptions matter most for shaping consideration.
- Quantify how much of the purchase likelihood is explained by changes in consideration.
- Determine whether any drivers influence the outcome directly (or only through the mediator).
- Reveal the “sequence of influence” across the buying journey.
5. Recommended Sample Size
- At least 200+ respondents for stable estimates
- More if subgroup analysis is required
Key Features and Considerations
Non-Negotiable Elements:
- ✅ Clear behavioral framework — outcome, mediator, and drivers must reflect a meaningful sequence (e.g., perceptions → intentions → behavior)
- ✅ One primary outcome metric that clearly represents the final stage of the journey
(e.g., purchase likelihood, satisfaction, recommendation) - ✅ One or more mediators that logically sit between drivers and the outcome
(e.g., trust, consideration, confidence) - ✅ Four or more distinct drivers capturing early perceptions or experience inputs
- ✅ Logical flow — begin with outcome, then mediator, then drivers to avoid biasing responses
- ✅ Consistent scaling for rating questions (Likert 1–5 or 0–10)
- ✅ Single concept per question to avoid ambiguity or mixed meaning
- ✅ Pilot test (50–100 completes) to ensure each variable has enough variance for modeling
Optional Enhancements:
- Randomize driver order to reduce priming or framing effects
- Add binary exposure items (e.g., “Did you see in-store signage?”) to strengthen early-stage predictors
- Include numeric behavior questions (frequency, spend, visits) for richer modeling
- Use visual scales or sliders to improve mobile response quality
- Include short open-ended prompts to capture unprompted journey drivers
- Pre-test mediator wording to ensure respondents interpret it as a middle step (e.g., intention, confidence)
Driver Definition Quality:
| ❌ Poor Driver Statement | ✅ Improved Driver Statement |
|---|---|
| “Good service” | “Staff provided clear and helpful guidance” |
| “Brand perception” | “[Brand] is a brand I can trust” |
| “High quality” | “[Brand]’s products feel durable and well-built” |
| “Easy purchase” | “It was easy to navigate the buying process” |
| “Strong marketing” | “Promotions or displays were clear and relevant to my needs” |
Path Analysis Diagram
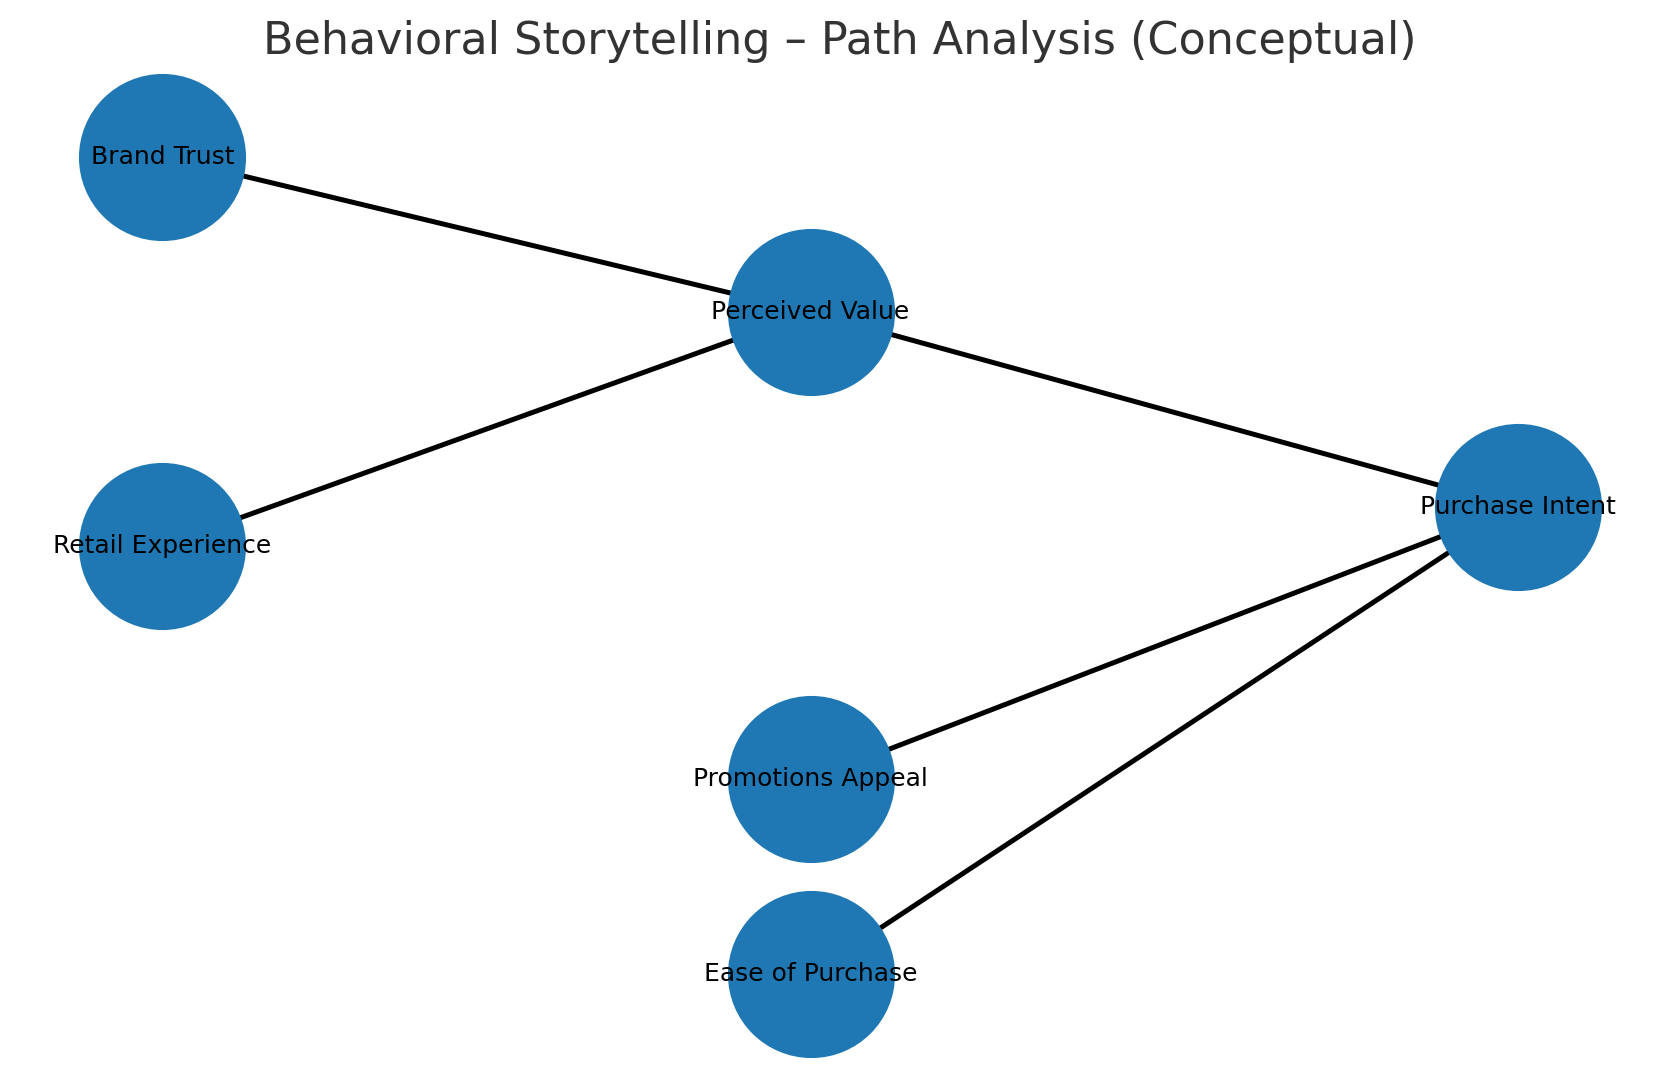
A directional map of direct and indirect pathways to the outcome (e.g., Brand Trust → Perceived Value → Purchase Intent). Great for behavioral storytelling. It clarifies how upstream drivers cascade into downstream outcomes. Arrows represent influence paths; thicker or labeled paths (if added) indicate stronger effects. Prioritize upstream nodes that drive multiple downstream wins.
Academic Papers and Textbooks
Core Statistical Foundations for Path Analysis
Baron, R. M., & Kenny, D. A. (1986).
The Moderator–Mediator Variable Distinction in Social Psychological Research.
Journal of Personality and Social Psychology.
– Seminal paper establishing mediation logic — the backbone of Path Analysis.
Introduced the conceptual flow of perceptions → intentions → behaviors.Kline, R. B. (2016).
Principles and Practice of Structural Equation Modeling (4th ed.).
– The most widely cited textbook for SEM and Path Analysis.
Covers model structure, direct/indirect effects, estimation, and interpretation.Hayes, A. F. (2018).
Introduction to Mediation, Moderation, and Conditional Process Analysis (2nd ed.).
– Practical, applied guide for mediation models.
Essential for interpreting indirect effects in marketing and behavioral research.
Behavioral Science Foundations
Ajzen, I. (1991).
The Theory of Planned Behavior.
Organizational Behavior and Human Decision Processes.
– Explains why intentions serve as the bridge between beliefs and behaviors.
Core theoretical justification for including mediators in Path Analysis.Fishbein, M., & Ajzen, I. (2010).
Predicting and Changing Behavior: The Reasoned Action Approach.
– Deep dive into belief → attitude → intention → behavior pathways.
Useful for explaining the behavioral logic behind the model to stakeholders.
Marketing & Consumer Decision Applications
Bagozzi, R. P. (1982).
A Field Investigation of Causal Relations Among Cognitions, Affect, Intentions, and Behavior.
Journal of Marketing Research.
– Classic empirical demonstration of causal pathways in consumer decisions.MacKinnon, D. P. (2008).
Introduction to Statistical Mediation Analysis.
– Strong technical grounding on indirect effects, bootstrap confidence intervals, and effect decomposition.Holbrook, M. B., & Hirschman, E. C. (1982).
The Experiential Aspects of Consumption.
Journal of Consumer Research.
– Highlights why experiential perceptions often initiate the journey toward intentions and behaviors, aligning with Path Analysis logic.
Ready to use this technique in your project? Contact the analytics team to discuss your requirements and next steps.
Email: Analytics@dtadvisorygroup.com
What to prepare for our discussion:
- The key outcome you want to explain (e.g., purchase likelihood, satisfaction, loyalty)
- A hypothesis about the journey — what perceptions or experiences might lead to the outcome, and through what intermediate steps
- The survey questionnaire or planned question set
- Target audience definition and expected sample size
- Desired subgroup analyses (markets, segments, demographics)
- Decision timeline and project context