MaxDiff (Best-Worst Scaling)
Statistical/Analytical Method
MaxDiff (Maximum Difference Scaling), also known as Best-Worst Scaling, is a structured survey technique that forces respondents to make trade-offs (forced selection).
Instead of asking people to rate 20 items on a 1–10 scale — where everything might cluster around 7 or 8 — we show small groups of items (usually 4–5 at a time) and ask two simple questions:
- “Which is MOST important?”
- “Which is LEAST important?”
By repeating this across carefully designed combinations of items, we estimate the relative importance of each item on a common scale. After that, the underlying model (multinomial logit or hierarchical Bayes) uses these best-worst choices to derive utility scores for every item.
The key idea: people are much better at choosing extremes than assigning absolute scores. Trade-offs reveal true priorities. The output is a clean ranking with meaningful distance between items — not just ordinal position, but how much more one item matters relative to another.
Problem It Solves
MaxDiff is designed for the classic business challenge:
“Everything feels important — how do we prioritize?”
When consumers face a long list of features, benefits, needs, or ideas, traditional rating scales often fail to differentiate. MaxDiff solves this by:
- Producing a clear rank order with genuine separation between items
- Measuring strength of preference, not just ordinal ranking
- Delivering a statistically robust prioritization that withstands scrutiny
- Eliminating scale-use bias — respondents who tend to rate everything high (or low) are treated equally
Common applications include:
- Which product features drive choice?
- Which benefits should we emphasize in communication?
- Which brand values resonate most?
- Which innovation ideas deserve investment?
- Which pain points are biggest?
MaxDiff is especially powerful when the item list is long (15–30 items), budget forces focus, and stakeholders need defensible evidence to back prioritization decisions.
Key Assumptions
For MaxDiff to produce valid and actionable results, several conditions should hold:
- Single evaluative dimension: All items can be meaningfully compared on one spectrum (e.g., importance, preference, appeal). Mixing fundamentally different categories undermines the comparison.
- Item independence: Respondents evaluate each item on its own merit. Items should not be so closely related that choosing one logically implies choosing another.
- Relative measurement: Standard MaxDiff measures relative preference only — it tells you which items matter more, not whether any item is good or bad in absolute terms.
Business Questions This Answers
MaxDiff is ideal when clients ask: “What really matters most?”
It helps answer strategic questions such as:
- Which features or benefits should we prioritize in the next product release?
- Which brand messages will resonate most with our target audience?
- Which customer needs should drive our innovation pipeline?
- Where should we focus limited resources for maximum impact?
- How do priorities differ across customer segments or markets?
It is particularly valuable when:
- The item list is long (15–30 items) and traditional ratings fail to differentiate
- Stakeholders need prioritization backed by statistical evidence, not just ratings
- Budget or resource constraints force genuine trade-offs
- Segment-level differences in priorities are expected
When NOT to Use
MaxDiff may not be a good fit when:
- You need to understand feature trade-offs and bundles: MaxDiff evaluates individual items, not combinations. Use conjoint analysis if you need to understand how feature bundles drive choice, or TURF analysis if you need to find the combination of features that reaches the widest audience.
- You need pricing sensitivity or willingness to pay: MaxDiff is not designed for price elasticity. Use Van Westendorp, Gabor-Granger, or conjoint with a price attribute instead.
- You need absolute measurement: Standard MaxDiff only tells you what matters more, not whether any item crosses a threshold of acceptability. Consider anchored MaxDiff or monadic concept testing if absolute acceptance matters.
- The item list is very short (fewer than 6 items): A simple ranking or paired comparison is more efficient and equally valid with so few items.
- Items span incomparable categories: If items mix abstract brand values with concrete product features, respondents cannot make coherent trade-offs. Restructure the list or run separate exercises.
- You need to understand “why”: MaxDiff tells you what is preferred but not why. Pair with qualitative research if understanding the reasoning behind preferences is critical.
Data Requirements
Data Type:
Survey data using a best-worst scaling design. Each respondent evaluates multiple sets of items, choosing the most and least important (or preferred) in each set.Item Count:
Ideally 15–30 items. Fewer than 6 makes MaxDiff unnecessary; more than 30 increases respondent burden and sample size requirements significantly.Items Per Set:
Typically 4–5 items per screen. Three is the minimum; beyond 5, cognitive load increases with diminishing statistical returns.Sets Per Respondent:
Typically 8–15 sets. Each item should appear at least 3 times per respondent for stable estimation. More sets improve precision but risk fatigue — cap at approximately 20.Sample Size:
Minimum 500 respondents for aggregate analysis with HB estimation. At least 200 per subgroup if segment-level analysis is required. See sample size section below for detail.Design Balance:
All items must appear the same number of times (attribute balance) and all pairs of items must co-occur the same number of times (paired balance). Specialized design software handles this.
Time Allocation
| Stage | Hours |
|---|---|
| Kick-off & planning | 2 |
| Analysis - overall | 8 |
| Analysis - per subgroup | 2 |
| Total (overall + 2 subgroups) | 14 hours |
Note: Add 2 hours per additional subgroup for analysis
Key Milestones (Analytics Perspective)
- Analytics Briefing: Initial project briefing with stakeholders to understand objectives and the decision context for prioritization
- Item List Finalization: Collaborative review and refinement of the item list — wording, granularity, and completeness
- Questionnaire Review: Review and validation of questionnaire design, MaxDiff task format, and survey logic
- Interim Data Provided: Preliminary data delivered for initial quality checks and validation
- Analytics Set Up Outputs: Output templates and analysis frameworks prepared and configured
- Final Data Provided: Complete dataset delivered with all quality checks passed
- Analytics Run Final Outputs: Final analysis executed, scores calculated, and outputs generated
- Debrief Attended by Analytics (if necessary): Analytics team available for findings presentation and Q&A session
Questionnaire
Sample Size Calculations
Overall analysis:
Minimum 500 respondents for reliable HB estimation.Subgroup analysis:
At least 200 respondents per subgroup for stable segment-level comparisons.Scaling with item count:
More items require more respondents to maintain estimation precision. The 500-respondent recommendation assumes approximately 30 or fewer items.Rule of thumb:
Ensure each item is evaluated at least 3 times per respondent. With 4 items per set and 20 items, 15 sets per respondent achieves this. With 4 items per set and 16 items, 12 sets achieves this.Data sufficiency:
Too few responses can lead to unstable importance rankings. It is better to have a well-designed study with adequate coverage than to stretch a small sample across too many items.
Example Question Structure
MaxDiff uses a simple, repeated task format. The two critical design decisions are: (1) the question wording and (2) the item list.
Task Introduction:
In the next section, we'll show you groups of [ITEMS/FEATURES/NEEDS].

For each group, please select:
• The one that is MOST important to you
• The one that is LEAST important to you

You'll see several groups — some items will appear more than once.
This is intentional. Please evaluate each group on its own.
[Hold screen for 10+ seconds with “Continue” button]
MaxDiff Task Screen (repeated for each set):
When choosing a [CATEGORY], which of the following is MOST important to you?
Which is LEAST important?

                                    LEAST          MOST
                                  IMPORTANT      IMPORTANT
[Item statement A]                   ○               ○
[Item statement B]                   ○               ○
[Item statement C]                   ○               ○
[Item statement D]                   ○               ○
[Minimum 5-second hold before allowing progression]
Question Wording Examples:
The question anchor should be specific, scenario-based, and decision-oriented:
Importance framing:
“When choosing a [category], which of the following is MOST important? Which is LEAST important?”Driver framing:
“Which of the following would MOST increase your likelihood to choose [Brand]? Which would LEAST increase it?”Needs framing:
“Which of the following best reflects your most important need? Which is least important to you?”
Avoid vague framing like “Which do you prefer?” without a decision context.
Full Survey Example — Gaming Audio Peripherals:
This example shows a complete MaxDiff module as it would appear in a questionnaire brief, including the question wording, item list, and design specifications sent to the data collection partner.
DECISION CRITERIA (MaxDiff)

ASK ALL dAUDIO_OWNER, MAX DIFF MODULE – SHOW 4 STATEMENTS PER SCREEN

A15. Imagine now that you were to purchase a new audio peripheral
     to use while gaming with your PC/laptop. This could be earphones,
     over-ear headphones / headset or speakers.

     Which of the following would MOST make you want to buy
     an audio peripheral? Which would LEAST make you want it?
MaxDiff Statement List (16 items):
| Code | Item Text |
|---|---|
| 1 | Long battery life between charges |
| 2 | Portable and easy to carry when travelling |
| 3 | Built to last (won’t break easily) |
| 4 | Crystal-clear, high-quality sound |
| 5 | Blocks out background noise |
| 6 | My voice sounds clear to others |
| 7 | Comfortable for long gaming sessions |
| 8 | Looks great (style and design) |
| 9 | Easy to set up and use |
| 10 | Reliable performance with no audio dropouts or connection issues |
| 11 | Fully compatible with my existing devices and platforms |
| 12 | Compact design that fits easily into my gaming setup |
| 13 | Customizable audio settings (e.g., EQ adjustments or sound profiles) |
| 14 | More immersive, “in the game” audio |
| 15 | Low-latency audio with no noticeable delay |
| 16 | Seamless switching between connected devices |
Design Specification (sent to DP partner):
- Number of statements per screen: 4 items per screen.
- Number of sets per respondent: 12 sets is the recommended starting point. With 16 items shown 4 at a time, 12 sets means each statement appears approximately 3 times per respondent — a good balance between coverage and survey length. Going down to 8 sets (each statement appears ~2 times) would shorten the survey, but coverage would be quite light and estimation less stable.
- Item balance: Each statement should appear roughly the same number of times across all sets for a given respondent.
- Item combinations: No specific pairing requirements. We are focused on individual item-level importance, not interactions between items.
- Randomization: Please randomize the order of sets across respondents, and randomize the item order within each screen.
Item Definition Quality:
| Poor Item Statement | Improved Item Statement |
|---|---|
| “Good sound” | “Provides the best sound quality possible” |
| “Easy to use” | “Is user-friendly and easy to operate” |
| “Good value” | “Offers great value for the price” |
| “Nice design” | “Has a unique or stand-out design” |
| “Reliable brand” | “Is from a brand with a long expertise and heritage” |
Key Features and Considerations
Non-Negotiable Elements:
- ✅ Clear task introduction explaining the best-worst format and that items will reappear
- ✅ Balanced experimental design generated by specialized software (not constructed manually)
- ✅ Randomized set order and item order within each set
- ✅ 4–5 items per set to balance cognitive load and statistical efficiency
- ✅ Minimum 5-second hold per screen before allowing progression
- ✅ Each item appears at least 3 times per respondent for stable estimation
- ✅ Single evaluative dimension — all items comparable on the same continuum
Optional Enhancements:
- Add an anchoring question after the MaxDiff exercise (e.g., “Which of these would you actually consider purchasing?”) to convert relative scores to absolute acceptance
- Include a practice set before the main exercise for unfamiliar audiences
- Use progress indicators to reduce dropout in longer exercises
- Add attention checks for exercises with 15+ sets
- Include open-ended follow-up to capture reasoning behind top priorities
MaxDiff Top Needs — Tiered Summary
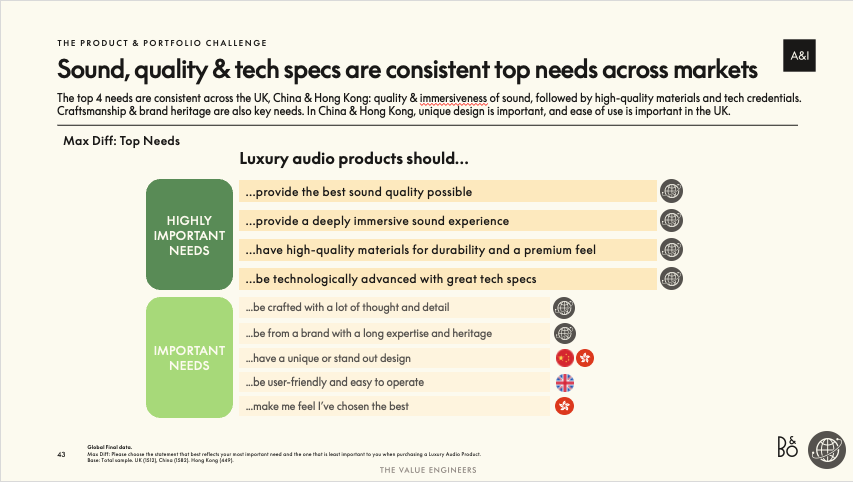
This tiered summary groups items into importance tiers based on their MaxDiff scores. Items in the top tier are clearly separated from the rest and represent the strongest priorities across all markets. Market flags highlight where specific items show particular strength or variation. This format is ideal for executive audiences who need a quick read on what matters most.
MaxDiff Importance Scores — Full Ranking by Market
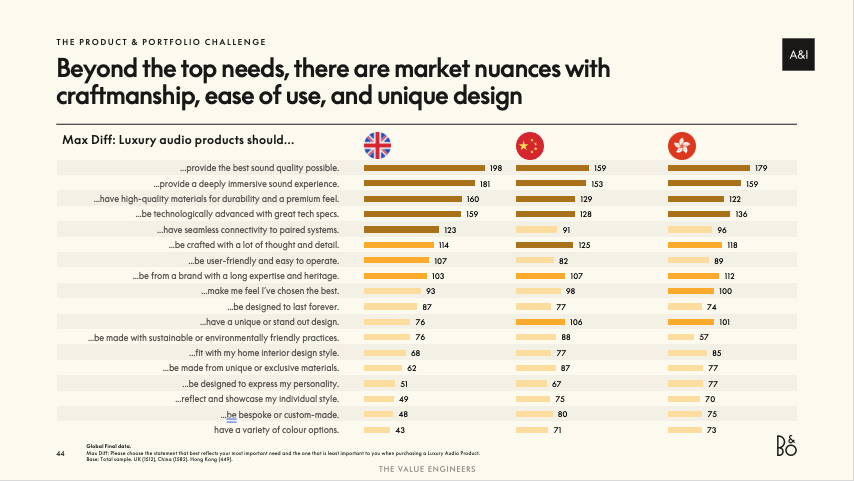
This full ranking displays rescaled importance scores for every item, broken out by market. Longer bars indicate higher relative importance. The scores are ratio-scaled: an item scoring 160 is roughly twice as important as one scoring 80. Natural breaks in the score distribution reveal tier boundaries. Cross-market comparison reveals which priorities are universal and where market-specific nuances exist.
Additional Output Types
MaxDiff analysis typically includes:
- Rescaled importance scores: Each item receives a score where all scores sum to 100 (or are indexed). These approximate the probability of each item being chosen as “most important” if all items were shown together.
- Rank order: A clean prioritization from most to least important with meaningful distance between items.
- Subgroup comparisons: Importance scores broken out by segment, market, or demographic group to reveal where priorities diverge.
- Count analysis: Simple best-minus-worst counts as a directional cross-check against the model-based utilities.
- Latent class segmentation: Identifying distinct preference segments within the sample based on MaxDiff utility patterns.
How to Interpret Scores
- Scores are relative to the item list tested — adding or removing items changes all scores
- A score of 15 vs. 5 means the first item is roughly three times as important as the second
- Look for natural breaks in the score distribution to identify tiers (top priorities, middle tier, low priorities)
- Items with similar scores are essentially interchangeable in importance
- Scores cannot be directly compared across different MaxDiff studies with different item lists
Previous Project Examples
Project 1: Bang & Olufsen — Why B&O the U&A
Academic Papers and Textbooks
Foundational Work
Finn, A., & Louviere, J. J. (1992).
Determining the Appropriate Response to Evidence of Public Concern: The Case of Food Safety.
Journal of Public Policy and Marketing.
– First formally published application of best-worst scaling.Marley, A. A. J., & Louviere, J. J. (2005).
Some Probabilistic Models of Best, Worst, and Best-Worst Choices.
Journal of Mathematical Psychology.
– Key theoretical paper establishing the mathematical framework for MaxDiff.Flynn, T. N., Louviere, J. J., Peters, T. J., & Coast, J. (2007).
Best-Worst Scaling: What It Can Do for Health Care Research and How to Do It.
Journal of Health Economics.
– Widely cited practical guide to implementing best-worst scaling.
Definitive Textbook
- Louviere, J. J., Flynn, T. N., & Marley, A. A. J. (2015).
Best-Worst Scaling: Theory, Methods and Applications.
Cambridge University Press.
– The comprehensive reference covering theory, design, estimation, and applications across all three cases of best-worst scaling.
Marketing Applications
- Louviere, J. J., Lings, I., et al. (2013).
An Introduction to the Application of (Case 1) Best-Worst Scaling in Marketing Research.
International Journal of Research in Marketing.
– Accessible introduction for marketing researchers with practical examples.
R Package Documentation
- tveMaxDiff package documentation (internal)
– TVE’s proprietary R package for MaxDiff analysis and visualization
Ready to use MaxDiff in your project? Contact the analytics team to discuss your requirements and next steps.
Email: Analytics@dtadvisorygroup.com
What to prepare for our discussion:
- The decision context — what prioritization question are you trying to answer?
- A draft list of items to evaluate (we’ll help refine wording and granularity)
- Target audience definition and expected sample size
- Desired subgroup analyses (markets, segments, demographics)
- Whether you are working with a DP partner or need TVE to handle the full analysis
- Decision timeline and budget parameters