Principal Component Analysis (Factor Analysis)
Statistical/Analytical Method
Principal Component Analysis (PCA), also known as Factor Analysis, is a way to reduce a long list of correlated survey variables into a smaller set of underlying factors.
PCA is a tool for simplifying complex survey data.
In brand or needs research, we often measure 20–40 attributes. Many of these move together because respondents perceive them as part of the same broader concept. PCA detects these shared patterns and compresses them into a few components that capture most of the variation in responses.
Each component is a weighted combination of the original items. The first component captures the strongest common factor in the data, the second captures the next strongest independent factor, and so on.
Imagine we ask respondents to rate how important the following are when choosing a coffee shop:
- “Helps me feel awake”
- “Boosts my energy”
- “Keeps me productive”
- “Gets me through the day”
- “Feels like a small treat”
- “Helps me relax”
- “Quick to get”
- “Easy to access”
Instead of working with 20-30 individual need statements, we may end up with 3–4 overarching dimensions such as:
- Energy & Productivity (Awake, Energy, Productive, Gets me through the day)
- Comfort & Indulgence (Treat, Relax, Comforting, Mood)
- Convenience & Fit (Quick, Easy access, Routine, On the go)
Each dimension captures what several related items have in common.
Problem It Solves
Survey batteries are sometimes long, redundant, and correlated. This creates three practical issues:
- Redundancy – Many items measure essentially the same underlying concept.
- Model instability – Correlated variables may impact the effectiveness and performance of downstream analytics (e.g., KDA, Segmentation).
- Overcomplex outputs – Too many inputs make it harder to communicate, visualize, and implement in analytical outputs.
PCA helps answer questions such as:
- What are the main factors that summarize a long list of needs or attributes?
- Which items reflect the same underlying theme?
- How can we simplify inputs so that we can plot them visually?
- How can we simplify inputs before segmentation or driver analysis?
What PCA Does — and What It Does Not Do
It:
- Identifies patterns in how variables move together.
- Detects broader themes behind long lists of attributes or needs.
- Reduces 30–40 overlapping items into a smaller set of dimensions.
- Makes downstream analysis (e.g., segmentation, modeling, storytelling) cleaner and more stable.
- Helps structure the data before moving to performance or driver analysis.
PCA does not:
- Automatically determine business priorities.
- Remove the need for interpretation — dimensions still need to be labeled and validated thoughtfully.
Importantly, PCA is outcome-blind. It reflects how respondents think and behave, not what impacts the business outcomes.
Key Assumptions
PCA works best when:
- There is meaningful correlation among items.
- The sample size is sufficient relative to the number of variables.
- Extracted components are interpretable in business terms.
- All input items are measured on a comparable scale (e.g., all 5-point Likert, all 1–10 ratings). Mixing scales undermines the correlation structure.
- No extreme outliers distort the correlation estimates.
If items are conceptually distinct and weakly correlated, PCA may not add value.
1. Identify Underlying Factors
For example, a 35-item brand perception battery might reduce to:
Trust & Reliability
(reliable, dependable, high quality, safe choice)
Innovation
(modern, cutting-edge, forward-thinking)
Accessibility
(easy to buy, widely available, convenient)
This enables clearer strategic discussion. Instead of debating individual attributes, we can focus on higher-level territories.
2. Data Visualization and Mapping
Survey data is often multi-dimensional. Each respondent may be described by 10, 20, or even 30 attributes. Visualizing such data directly is impossible beyond three dimensions.
PCA makes it feasible to:
- Reduce the data to two/three principal dimensions.
- Plot respondents in a 2D/3D map.
- Visualize brand positioning or respondent distribution in a clear way.
These maps do not capture all variance, but they provide an intuitive view of structure that would otherwise be invisible.
3. Pre-processing for Key Driver Analysis (KDA) and Segmentation
When running KDA, overlapping inputs can create instability:
- Coefficients become unstable.
- Similar attributes compete with each other.
- Importance becomes difficult to interpret.
PCA can be used to reduce redundancy before modeling.
In segmentation work, large correlated batteries can dominate clustering solutions. Without reduction, the segmentation may primarily reflect brand perception differences rather than a balanced view of behaviors and needs.
There are three common approaches to data pre-processing:
A. Representative Item Approach
Select the highest-loading item from each component and use it as a proxy.
- Easy to explain.
- Keeps inputs at the question level.
- However, one item may not fully represent the broader theme.
B. Component Score Approach
Use calculated component scores directly.
- Statistically stable.
- Reduces redundancy cleanly.
- Slightly more abstract unless clearly labeled.
C. Index Construction Approach (Often Preferred)
Group items based on PCA results and create composite indices (e.g., average of standardized items within each theme).
- Maintains interpretability.
- More stable than single-item proxies.
- Practical for tracking and reporting.
Business Questions This Answers
PCA is particularly helpful when:
- Working with long attribute batteries (20+ items).
- Preparing inputs for KDA.
- Preparing inputs for segmentation.
- Simplifying reporting for workshops or strategy discussions.
- Creating perceptual or respondent maps for visualization.
When NOT to Use
PCA may be unnecessary when:
- The attribute list is already concise and distinct.
- The business requires purely item-level reporting.
- There is limited overlap among variables.
- The item battery is too small (fewer than ~8 items).
- Items are measured on very different scales (e.g., mixing binary, Likert, and continuous).
- Sample size is too small (fewer than ~100 respondents or fewer than 5 observations per item).
Reduction should solve a real problem — not be applied by default.
Alternative approaches:
- Simple ranking or top-box reporting for small item sets
- Correlation analysis for understanding pairwise relationships
- Cluster analysis on items (rather than respondents) for grouping without assuming linear structure
Data Requirements
- Data Type: Survey data with a battery of rated or multi-coded items — typically brand attributes, experience statements, satisfaction items, or attitudinal measures
- Scale Consistency: All items should use the same or very similar response scales (e.g., all 5-point agreement, all 1–10 ratings, 1/0 binary code). This is critical for PCA to produce meaningful results.
- Item Count: Typically 10–40+ items to reduce. Fewer than ~8 items may not yield meaningful components.
- Sample Size: With a practical minimum of ~100 respondents. Larger samples (200+) produce more stable and replicable factor solutions.
- Data Quality: Items should show reasonable variance — items where nearly everyone gives the same answer contribute little to the analysis, items that are completely irrelevant and distinct contribute little to the analysis
Time Allocation
PCA standalone (data already available):
| Stage | Hours |
|---|---|
| Data review & preparation | 1–2 |
| Run PCA & review factor solution | 2–3 |
| Label themes & document loadings | 1–2 |
| Total | 4–7 hours |
Note: These hours are in addition to the downstream technique’s own time allocation (see KDA or Segmentation pages). PCA adds roughly half a day to the overall analysis phase.
Key Milestones (Analytics Perspective)
Because PCA typically sits within a larger analytical workflow, its milestones are integrated into the broader project rather than tracked independently:
- Analytics Briefing: Understand the research objectives and confirm that the item battery is suitable for reduction (consistent scales, sufficient item count)
- Questionnaire Review: Validate that items use comparable scales and that the battery is long enough to warrant PCA. Flag any scale inconsistencies early.
- Data Received: Once fieldwork is complete and data is delivered, PCA is one of the first analytical steps — typically run the same day the data lands.
- PCA Completed & Factors Reviewed: Components extracted, loadings reviewed, and themes labelled. This is a checkpoint with the project lead to confirm the factor solution makes sense before feeding it downstream.
- Downstream Analysis (KDA / Segmentation): The reduced factors are passed into the main analytical workflow.
- Final Outputs Delivered: PCA outputs (loading matrix, theme labels) are included alongside the downstream analysis deliverables.
Questionnaire
Sample Size Calculations
- Overall analysis: Minimum ~100 respondents, though 200+ is strongly preferred for stable factor solutions
- Subgroup analysis: Minimum 100 respondents per subgroup if running separate PCA per subgroup
- Rule of thumb: At least 5–10 respondents per item in the battery. For example, a 30-item battery should target at least 150–300 respondents.
- More items = more respondents: Larger batteries need proportionally larger samples for stable estimates
Example Question Structure
PCA does not require a specific questionnaire format — it works with any multi-item battery. However, the critical requirement is that all items use a consistent response scale so the correlations are meaningful.
Typical Input: Attribute Agreement Battery
How much do you agree or disagree with each of the following statements about [PRODUCT/BRAND]?

(5-point scale: Strongly disagree → Strongly agree)

• The world is large enough to get lost in
• The world is rich in detail and full of things to discover
• I feel immersed in a different time and place
• The enemies are challenging to fight
• The combat is spectacular and attractive to watch
• The main character has a very compelling story
• The game has a deep and interesting story overall
• I can develop my character's skill set and abilities
...
Typical Input: Multi-Code / Select All That Apply Battery
Which of the following do you associate with [BRAND]? Please select all that apply.

• Innovative
• Trustworthy
• Good value for money
• Premium quality
• Fun and exciting
• Environmentally responsible
• Family-friendly
• For people like me
...
Each item becomes a binary (1/0) variable. PCA can detect which associations tend to cluster together — for example, “Innovative,” “Premium quality,” and “Fun and exciting” might load onto a single “Brand Vitality” component.
Key Features and Considerations
Non-Negotiable Elements:
- ✅ Consistent response scales across all items in the battery — this is the single most important requirement
- ✅ Sufficient item count (typically 10+) to allow meaningful reduction
- ✅ Distinct, non-redundant items — each statement should capture a slightly different concept
- ✅ Randomized item order within the battery to reduce order effects
- ✅ Clear, unambiguous item wording that respondents can evaluate independently
Loading Matrix
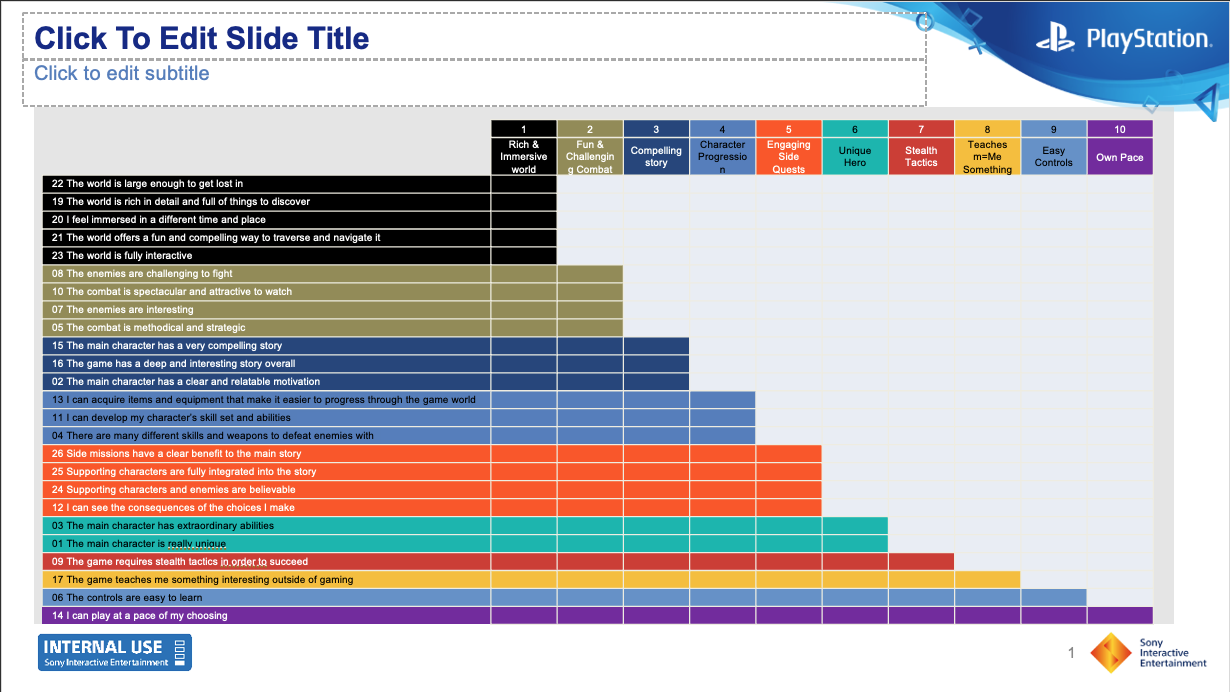
This loading matrix visualises how 30 gaming experience attributes reduce to 10 interpretable themes. Each component captures a cluster of related perceptions:
- Component 1 — Rich & Immersive World: items about world size, detail, immersion, and interactivity
- Component 2 — Fun & Challenging Combat: items about enemy difficulty, combat aesthetics, and strategic depth
- Component 3 — Compelling Story: items about narrative depth, character motivation, and story quality
- Component 4 — Character Progression: items about skill development, equipment acquisition, and ability growth
- Component 5 — Engaging Side Quests: items about side mission integration and supporting characters
And so on through all extracted components.
How the Output Is Used
PCA/Factor Analysis outputs are typically used in two ways:
- Direct reporting: The themes and their constituent items are presented as a structured summary of the attribute battery — making it easier for stakeholders to understand what drives perceptions
- Downstream modelling input: The component scores (one score per respondent per component) are fed into a Key Drivers Analysis or segmentation as cleaner, less collinear variables than the raw items
Previous Project Examples
Project 1: PlayStation — Ghost of Yotei Post Launch
Academic Papers and Textbooks
Core Statistical Foundations
Jolliffe, I. T., & Cadima, J. (2016). Principal Component Analysis: A Review and Recent Developments. Philosophical Transactions of the Royal Society A. – Comprehensive modern review of PCA methodology, extensions, and applications.
Hair, J. F. et al. (2019). Multivariate Data Analysis (8th ed.). – Core reference for PCA, Factor Analysis, and determining the number of components to retain.
Tabachnick, B. G., & Fidell, L. S. (2019). Using Multivariate Statistics (7th ed.). – Practical guide covering PCA and Factor Analysis with step-by-step interpretation guidance.
Methodological Guidance
Kaiser, H. F. (1960). The Application of Electronic Computers to Factor Analysis. Educational and Psychological Measurement. – Introduced the Kaiser criterion (eigenvalue > 1) for determining the number of factors to retain.
Cattell, R. B. (1966). The Scree Test for the Number of Factors. Multivariate Behavioral Research. – Introduced the scree plot method for component retention decisions.
Velicer, W. F., & Jackson, D. N. (1990). Component Analysis versus Common Factor Analysis: Some Issues in Selecting an Appropriate Procedure. Multivariate Behavioral Research. – Clarifies when to use PCA versus Factor Analysis and the practical implications of each.
Market Research Applications
- Malhotra, N. K. (2019). Marketing Research: An Applied Orientation (7th ed.). – Covers the application of Factor Analysis and PCA in marketing research contexts, including brand perception and customer satisfaction studies.
R Package Documentation
- tveFactorAnalysis package documentation (internal) – TVE’s proprietary R package for Factor Analysis and PCA automation and visualisation
Ready to use PCA/Factor Analysis in your project? Contact the analytics team to discuss your requirements and next steps.
Email: Analytics@dtadvisorygroup.com
What to prepare for our discussion:
- The item battery or attribute list you want to reduce
- Confirmation that items use a consistent response scale
- Expected sample size and any subgroup requirements
- Whether the output will be used for direct reporting, downstream modelling (KDA, segmentation), or both
- Decision timeline and project context