TURF
Statistical/Analytical Method
TURF (Total Unduplicated Reach and Frequency) is a portfolio optimization method that identifies which combination of items — products, features, flavors, or messages — appeals to the widest cross-section of consumers.
Unlike simple popularity rankings, TURF accounts for overlap in appeal. A top-ranked item and the second-ranked item might both appeal to the same group of people. A mid-ranked item might reach an entirely different segment. TURF finds the combination that maximizes unduplicated reach — the total number of people reached by at least one item in the portfolio.
The method works with binary data: for each respondent, every item is either acceptable (1) or not (0). TURF then evaluates all possible combinations of a given portfolio size and identifies the combination that covers the most respondents.
TURF originated in media planning (selecting media channels to maximize audience reach) and was adapted for product and marketing research in the early 1990s. Today it is widely used for product line optimization, flavor range planning, messaging portfolio selection, and feature prioritization.
Problem It Solves
TURF solves the classic portfolio question:
“If we can only offer N items, which N should we choose to reach the most people?”
Popularity alone doesn’t answer this. The most popular items often appeal to overlapping audiences, so choosing the top 5 by popularity may leave large segments unserved. TURF solves this by:
- Finding the combination that maximizes total audience coverage, not just average preference
- Revealing where diminishing returns set in — the point where adding more items barely increases reach
- Identifying items with unique reach — those that bring in consumers no other item attracts
- Exposing redundancy — items that are popular but appeal to the same people already covered
- Locking in must-haves and optimizing around them — if certain items are fixed in the portfolio, TURF identifies which additional items add the most incremental reach
- Comparing optimal portfolios across subgroups — revealing whether the best combination differs by market, segment, or demographic
Common applications include:
- Product reach: Which flavors, SKUs, or variants should we stock to cover the most shoppers?
- Feature interest: Which features should we include in the base product to satisfy the widest audience?
- Messaging reach: Which 3 of these 10 campaign messages should we lead with for maximum audience coverage?
- Ambassador/partnership reach: Which brand ambassadors or sponsorship partners collectively reach the broadest fan base?
- Brand awareness: Which brands in a portfolio are known by the widest, most diverse audience — and where do awareness gaps exist?
- Media/channel reach: Which media channels or touchpoints should we invest in to reach the most consumers with the least overlap?
- Portfolio size: What’s the optimal number of items before adding more barely increases reach?
Key Assumptions
For TURF to produce valid and actionable results, several conditions should hold:
- Binary eligibility: Each item either reaches a respondent or it doesn’t. TURF requires a clean accept/reject classification — there is no gradient of preference intensity.
- Item independence: Adding or removing an item from the portfolio does not change how consumers feel about the remaining items. TURF cannot model cannibalization or substitution effects between items.
Business Questions This Answers
TURF is ideal when clients ask: “Which combination gives us the best coverage?”
It helps answer strategic questions such as:
- Product reach: Which products or SKUs should we include in a limited range to cover the most shoppers?
- Messaging reach: Which 3 of these 10 campaign messages should we lead with for maximum audience reach?
- Feature interest: Which features should we include to satisfy the widest range of customer needs?
- Ambassador/partnership reach: Which combination of brand ambassadors or partners collectively reaches the most fans?
- Brand awareness: Which brands in our portfolio have the widest awareness — and where are the gaps?
- Media/channel reach: Which channels or touchpoints should we prioritize to reach the most consumers with the least overlap?
- Portfolio size: What is the optimal number of items before adding more stops meaningfully increasing reach?
- Fixed-item expansion: We’ve already committed to items A and B — which additional items would add the most new reach?
- Segment comparison: How does the optimal portfolio differ across markets or customer segments?
It is particularly valuable when:
- Resources or shelf space constrain the number of items you can offer
- The item set is large enough that intuition alone can’t identify the best combination
- Stakeholders need defensible evidence for portfolio decisions
- Understanding overlap and redundancy matters as much as popularity
When NOT to Use
TURF may not be a good fit when:
- You need to understand individual item importance or ranking: TURF optimizes combinations, not individual items. Use MaxDiff if you need a clean ranking of which items matter most.
- Pricing or willingness to pay matters: TURF does not incorporate price. Use conjoint analysis or Van Westendorp if price-volume trade-offs are central to the decision.
- Cannibalization or source of volume is critical: TURF cannot measure how a new product steals share from existing offerings. Use choice modeling if understanding volume redistribution matters.
- You’re optimizing features within a single product: TURF selects which items to include in a portfolio, not which features to bundle into one product. Use conjoint analysis for feature bundling decisions.
- Preferences are unstable or the category is high-frequency variety-seeking: TURF assumes a consumer is satisfied once they find one acceptable item. This breaks down in categories like snacks or beverages where consumers routinely buy multiple variants.
- The item list is very small (fewer than 5): With so few items, a simple cross-tabulation or ranking is sufficient — TURF adds complexity without insight.
- You haven’t screened items yet: TURF is for optimizing finalists, not for broad ideation. If you have 25+ ideas, screen them first with MaxDiff or concept testing, then run TURF on the shortlist.
Data Requirements
Data Type:
Survey data producing a binary outcome per item per respondent — either via direct selection (select all that apply) or by applying a threshold to a rating scale.Item Count:
Ideally 8–15 items. Fewer than 5 makes TURF unnecessary; above 20 increases cognitive burden, produces noisy data, and creates unstable combinatorics.Binary Classification:
Every item must translate cleanly into 1 (reaches this person) or 0 (does not). This can come from a forced binary question or from a pre-defined threshold on a likelihood scale (e.g., top-2 box = reach).Sample Size:
Minimum 300 respondents for basic analysis. 500–1,000 preferred for reliable portfolio simulation. Each subgroup needs adequate sample for stable optimization. See sample size section below for detail.Item Comparability:
All items must be at the same level of development and specificity. Do not mix fully built concepts with half-formed ideas, or concrete offers with vague positioning.
Time Allocation
| Stage | Hours |
|---|---|
| Kick-off & planning | 2 |
| Analysis - overall | 6 |
| Analysis - per subgroup | 2 |
| Total (overall + 2 subgroups) | 12 hours |
Note: Add 2 hours per additional subgroup for analysis
Key Milestones (Analytics Perspective)
- Analytics Briefing: Initial project briefing with stakeholders to understand objectives, portfolio constraints, and decision context
- Item List Finalization: Collaborative review of the item list — ensuring items are comparable, specific, and actionable
- Questionnaire Review: Review and validation of questionnaire design, binary classification approach, and survey logic
- Interim Data Provided: Preliminary data delivered for initial quality checks and validation
- Analytics Set Up Outputs: Output templates and analysis frameworks prepared and configured
- Final Data Provided: Complete dataset delivered with all quality checks passed
- Analytics Run Final Outputs: Final analysis executed, portfolio optimization completed, and outputs generated
- Debrief Attended by Analytics (if necessary): Analytics team available for findings presentation and Q&A session
Questionnaire
Sample Size Calculations
Overall analysis:
Minimum 300 respondents for basic TURF. 500–1,000 preferred for reliable portfolio simulation.Subgroup analysis:
Each segment needs adequate sample for stable optimization. Small segments produce unstable optimal portfolios.Why sample size matters:
Low-incidence items swing wildly across combinations with small samples. Small N exaggerates noise and can identify “optimal” portfolios that won’t replicate. If this is guiding a launch decision, invest in adequate sample.Rule of thumb:
For items with low acceptance rates (under 20%), you need larger samples to distinguish genuine reach differences from noise.
Example Question Structure
TURF requires a question format that produces clean binary (0/1) data per item per respondent. There are two main approaches:
Option A: Forced Binary (Best Practice)
Which of the following would you seriously consider purchasing
in the next [TIME FRAME]?

(Select all that apply)

□ [Concept A]
□ [Concept B]
□ [Concept C]
□ [Concept D]
□ [Concept E]
□ None of these
Why this works:
- Directly measures reach eligibility
- No artificial trade-offs
- Clean interpretation — no threshold decision needed
Option B: Likelihood Scale (When You Need Sensitivity)
How likely are you to purchase each of the following?

                        Definitely  Probably  Might or   Probably  Definitely
                          would      would   might not  would not  would not

[Concept A]                ○          ○         ○          ○          ○
[Concept B]                ○          ○         ○          ○          ○
[Concept C]                ○          ○         ○          ○          ○
[Concept D]                ○          ○         ○          ○          ○
[Concept E]                ○          ○         ○          ○          ○
Then pre-define the threshold before data collection:
- Top-2 box (Definitely + Probably) = reach
- Or “Definitely” only for a stricter definition
Important: Define the threshold before seeing the data. Choosing the cutoff after seeing results is outcome fishing.
Key Features and Considerations
Non-Negotiable Elements:
- ✅ Clean binary outcome — every item must produce a defensible 0/1 classification per respondent
- ✅ No ranking questions — ranking distorts reach. TURF measures coverage, not preference order
- ✅ No forced single choice — forcing one selection kills duplication effects, which is the entire point of TURF
- ✅ Randomized item order — primacy bias inflates early items and distorts portfolio optimization
- ✅ Comparable items — all items at the same level of specificity and development
- ✅ “None of these” option — allows respondents who genuinely find nothing acceptable to say so
- ✅ Pre-defined threshold — if using a likelihood scale, the reach cutoff must be set before data collection
Optional Enhancements:
- Include a “must-have” follow-up to identify items that should be locked into the portfolio regardless of optimization
- Run TURF alongside MaxDiff — use MaxDiff for individual importance ranking and TURF for portfolio optimization (see relationship below)
- Add open-ended reasoning to understand why certain items are selected or rejected
- Include competitive items in the set if you need to benchmark reach against competitor portfolios
- Run sensitivity analyses across multiple thresholds if using a likelihood scale
Item Definition Quality:
| ❌ Poor Item Definition | ✅ Improved Item Definition |
|---|---|
| “Chocolate flavor” | “Rich dark chocolate with cocoa nibs” |
| “Healthy option” | “High-protein, low-sugar bar (15g protein, 3g sugar)” |
| “Premium product” | “Handcrafted small-batch with single-origin ingredients” |
| “Good for the environment” | “100% recyclable packaging with carbon-neutral certification” |
| “New and exciting” | “Limited-edition seasonal flavor, available for 3 months” |
Relationship to MaxDiff
TURF and MaxDiff are complementary methods frequently paired in a two-stage workflow:
- MaxDiff answers: “Which individual items are most preferred?” — it produces a clean ranking with meaningful distance between items
- TURF answers: “Which combination of items reaches the most people?” — it identifies the portfolio that maximizes audience coverage
Typical combined workflow:
- Run a MaxDiff study to collect preference data across a large item set
- Define a TURF threshold on the MaxDiff utility scores (e.g., classify an item as “acceptable” if the respondent’s utility score exceeds a cutoff)
- Run TURF optimization on the binary data to find the portfolio that maximizes unduplicated reach
This pairing works well because MaxDiff handles the preference measurement problem (forcing discrimination between items), while TURF handles the portfolio optimization problem (finding the combination that maximizes breadth, not just average preference).
Reach Curve (Waterfall Chart)
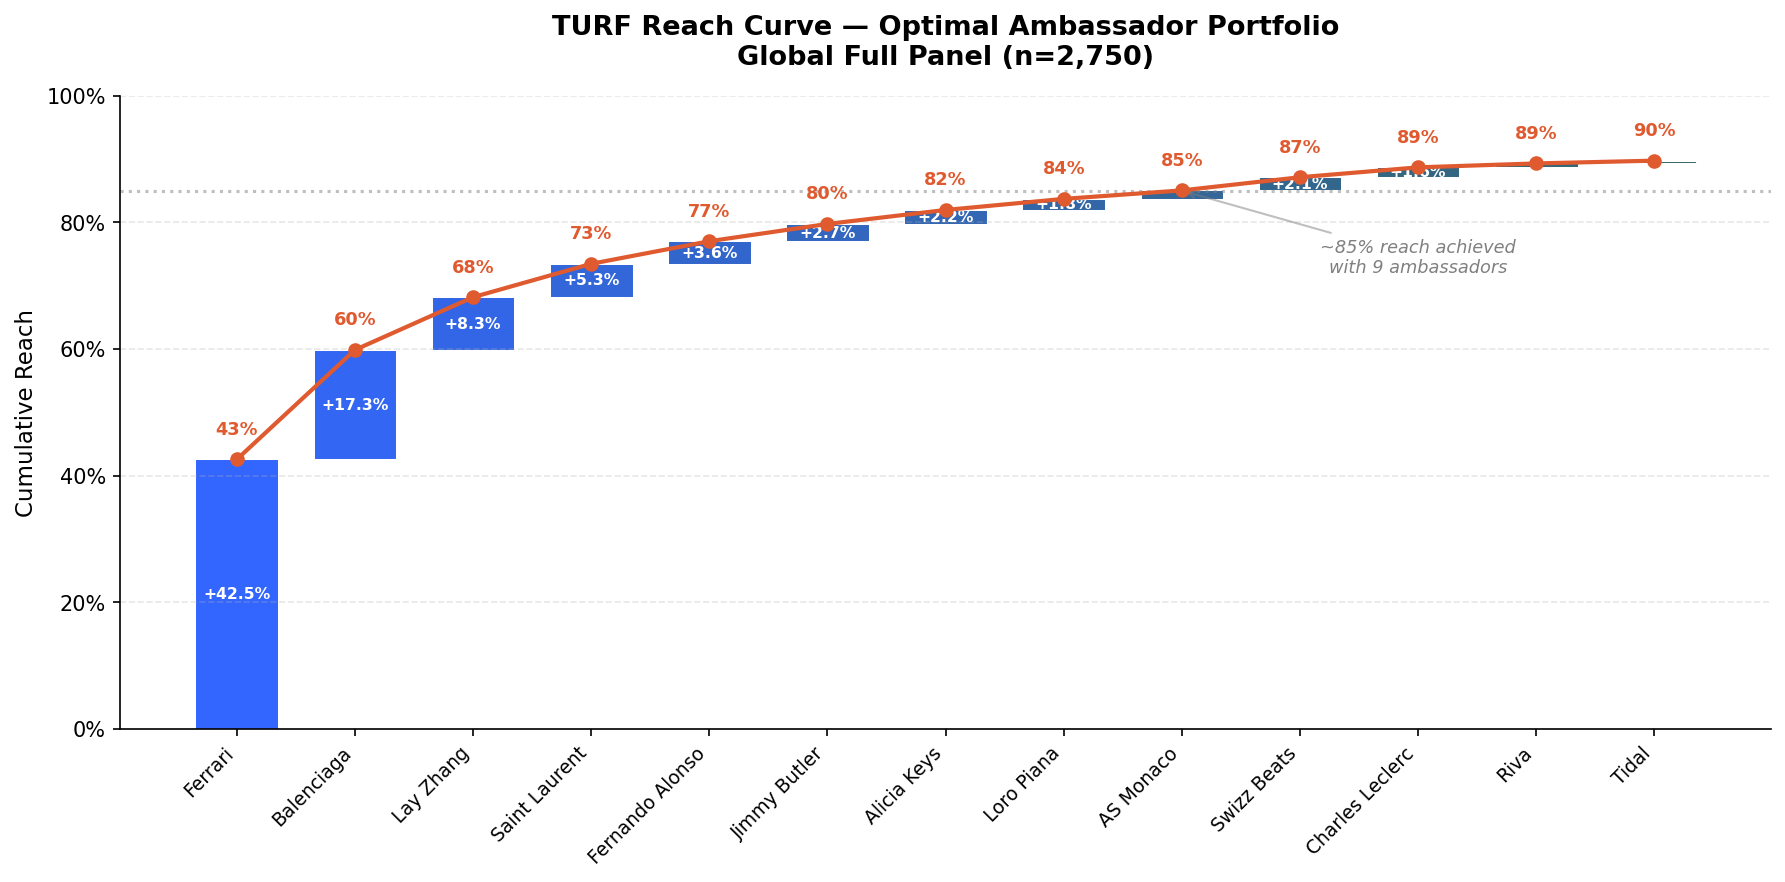
The signature TURF output. Each bar represents the incremental reach added by the next best item in the portfolio. The cumulative line shows total audience coverage. This visualization reveals the point of diminishing returns — where adding more items no longer meaningfully increases reach. It directly answers: “How many items do we actually need?”
Incremental Reach Report
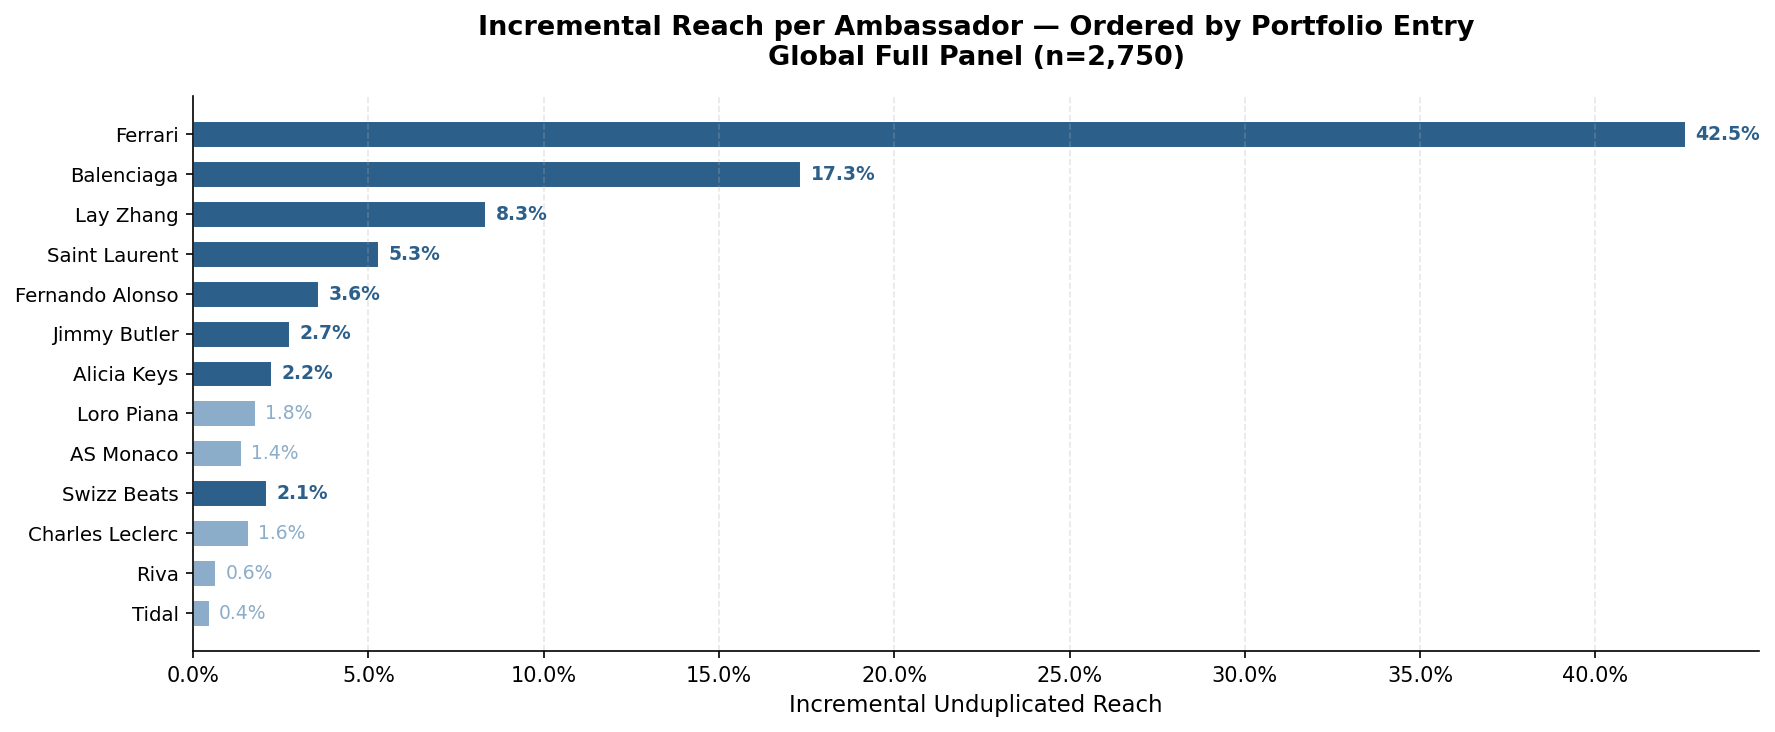
Each bar shows how much new reach an ambassador adds beyond what’s already covered. Ferrari alone reaches 42.5% of the audience; Balenciaga adds another 17.3% of previously unreached consumers. By the time we reach the 7th ambassador (Alicia Keys), each addition contributes only about 2% incremental reach.
Additional Output Types
TURF analysis typically includes:
- Optimal portfolio table: The best combination of N items for each portfolio size (best 2, best 3, best 4, etc.), with total unduplicated reach and frequency for each.
- Incremental reach report: Each item’s marginal contribution to total reach, answering: “Given the items already locked in, which item adds the most new people?”
- Duplication matrix: Overlap between every pair of items — high overlap means redundancy, low overlap means complementary reach.
- Reach by segment: Optimal portfolios broken out by market, demographic, or attitudinal segment to reveal where the best combination differs.
- Locked-item analysis: Scenarios where certain items are “must-haves” and the optimization runs over the remaining slots — reflecting real-world constraints where some SKUs cannot be dropped.
Previous Project Examples
Project 1: Bang & Olufsen — Why B&O the U&A (Ambassador Reach Analysis)
Academic Papers and Textbooks
Foundational Work
- Miaoulis, G., Free, V., & Parsons, H. (1990).
TURF: A New Planning Approach for Product Line Extensions.
Marketing Research.
– The paper that introduced TURF to marketing research, adapting reach-and-frequency concepts from media planning to product line optimization.
Methodological Advances
- Serra, D., & ReVelle, C. (2013).
Implementing TURF Analysis Through Binary Linear Programming.
Food Quality and Preference.
– Introduces a binary linear programming formulation that makes TURF computationally tractable for large item sets.
Practitioner References
Orme, B. (2016).
A Simple Introduction to TURF Analysis.
Sawtooth Software Technical Paper.
– A clear, accessible overview of TURF methodology covering reach calculation, threshold setting, and portfolio optimization.Hasted, A. (2023).
Product Portfolio Management: TURF.
In C. Gomez-Corona & H. Rodrigues (Eds.), Consumer Research Methods in Food Science. Humana/Springer.
– A practical walkthrough of TURF for product portfolio decisions with worked examples from food science research.
R Package Documentation
- tveTURF package documentation (internal)
– TVE’s proprietary R package for TURF analysis and portfolio optimization
Ready to use TURF in your project? Contact the analytics team to discuss your requirements and next steps.
Email: Analytics@dtadvisorygroup.com
What to prepare for our discussion:
- The portfolio decision you’re trying to make — how many items can you offer, and what’s the constraint?
- A draft list of items to evaluate (we’ll help refine definitions and ensure comparability)
- Whether items have already been screened or ranked (e.g., via MaxDiff) or if this is the first evaluation
- Target audience definition and expected sample size
- Desired subgroup analyses (markets, segments, demographics)
- Any “must-have” items that should be locked into the portfolio regardless of optimization
- Decision timeline and budget parameters