VWD / Gabor-Granger
Overview
Pricing research helps clients understand what consumers are willing to pay — and where price becomes a barrier or a signal of poor quality. TVE’s standard pricing toolkit uses two complementary survey-based methods that are typically run together in a single project:
- Van Westendorp Price Sensitivity Meter (VWD): Identifies the acceptable price range — the corridor where consumers consider prices neither too cheap nor too expensive.
- Gabor-Granger: Measures demand at specific price points within that range and identifies the price that maximizes revenue.
Together, they answer: “What price range does the market accept?” (Van Westendorp) and “Within that range, what price maximizes revenue?” (Gabor-Granger).
Where does conjoint fit? Conjoint analysis is a more advanced pricing method that treats price as one attribute among many (features, brand, quality). It is best suited for scenarios where pricing decisions depend on product configuration, competitive simulation, or feature-level trade-offs. Conjoint is covered on its own page — use it when the pricing question cannot be separated from the product design question.
How Van Westendorp Works
Van Westendorp uses four open-ended price questions. Each respondent provides a numeric price for each, and the cumulative distributions of responses are plotted as curves. Where the curves intersect defines the price boundaries.
The Four Questions:
- Too Expensive: “At what price would you consider it to be so expensive that you would not consider buying it?”
- Too Cheap: “At what price would you consider it to be priced so low that you feel the quality couldn’t be very good?”
- Expensive (starting to hesitate): “At what price would you consider it as starting to get expensive, where you would have to think about buying it?”
- Bargain: “At what price would you consider it to be a bargain — a great buy for the money?”
The four response distributions are plotted on the same chart. Their intersections produce four key price points:
| Output | What It Tells You |
|---|---|
| Point of Marginal Cheapness (PMC) | The lower boundary — below this, too many consumers question quality |
| Indifference Price Point (IDP) | The price consumers consider “normal” — equal numbers find it cheap vs. expensive |
| Optimal Price Point (OPP) | The price with minimum resistance — fewest people reject it as too cheap or too expensive |
| Point of Marginal Expensiveness (PME) | The upper boundary — above this, too many consumers walk away on price |
The acceptable price range runs from PMC to PME. This range becomes the input for Gabor-Granger.
How Gabor-Granger Works
Gabor-Granger is a demand-based pricing method. Respondents are shown the product at a randomly assigned starting price and asked whether they would purchase. Based on their answer, the price moves up or down until their maximum acceptable price is identified.
The Sequential Process:
- Respondent sees the product at a randomly selected price from a pre-defined set (e.g., 5–7 price points)
- They indicate whether they would purchase at that price
- If yes: the next screen shows a higher price from the set
- If no: the next screen shows a lower price from the set
- This continues until the method identifies their price threshold — the highest price at which they would still buy
The result is a demand curve showing the percentage of consumers willing to buy at each tested price. Multiplying each price by its demand percentage produces a revenue curve — the peak of which is the revenue-maximizing price.
Gabor-Granger can also include competitive context. In the Pod Point pricing project, respondents saw the product alongside two competitors at fixed prices, so the purchase decision at each price point was made relative to real alternatives.
Key Assumptions
For both methods to produce valid results, several conditions should hold:
- Respondents hold meaningful price anchors: Consumers must have enough familiarity with the product or category to form genuine price expectations. Both methods assume respondents can articulate what feels cheap, fair, or expensive.
- Price is the primary decision variable: Both methods evaluate price in relative isolation. If the purchase decision depends heavily on feature configuration, brand positioning, or competitive dynamics, conjoint analysis is more appropriate.
- Price can signal quality: Van Westendorp explicitly assumes that a price can be “too low” — that consumers may reject a product if the price suggests poor quality. This holds for most consumer categories but may not apply to commodities.
- Pre-selected price points cover the right range (Gabor-Granger): The quality of Gabor-Granger results depends on choosing appropriate price points to test. Running Van Westendorp first eliminates this guesswork.
Business Questions This Answers
These methods are ideal when clients ask: “What should we charge?”
They help answer strategic questions such as:
- Acceptable price range: What price corridor does the market consider reasonable for this product?
- Revenue-maximizing price: Within the acceptable range, which price point maximizes revenue?
- Price sensitivity: How quickly does demand drop as price increases? Is the market price-sensitive or price-tolerant?
- Competitive pricing: At what price does our product lose to competitors? Where does it win?
- Segment differences: Do different customer segments have different price thresholds or willingness to pay?
- Price positioning: Is our current price perceived as a bargain, fair value, or expensive?
- Launch pricing: For a new product, what price range should we test in market?
It is particularly valuable when:
- The product concept is defined and price is the key unknown
- Stakeholders need evidence-based pricing guidance, not gut feel
- You want both an exploratory view (acceptable range) and a confirmatory view (revenue-maximizing price)
- Budget or timeline constraints preclude full conjoint analysis
When NOT to Use
Van Westendorp and Gabor-Granger may not be a good fit when:
- Price depends on product configuration: If the pricing question is inseparable from feature selection (e.g., “How much more would they pay for the premium tier?”), use conjoint analysis instead. Conjoint treats price as one attribute among many and can simulate pricing across different product configurations.
- You need competitive market simulation: If the question is “What happens to our share if the competitor drops price by 10%?”, standard pricing methods cannot answer this. Use choice-based conjoint with a market simulator.
- The product is radically new: If respondents have no category reference point, they cannot form meaningful price expectations. Consider concept testing paired with monadic pricing or conjoint.
- You need precise demand forecasting: Both methods measure stated intent, not actual behavior. Stated willingness to pay tends to overestimate real-world willingness by 15–30%. Use these methods for directional guidance, not exact volume forecasting.
- The item list is the question, not the price: If you’re deciding what to offer rather than what to charge, use MaxDiff or TURF instead.
Data Requirements
Data Type:
Survey data. Van Westendorp uses four open-ended numeric questions. Gabor-Granger uses sequential closed-ended purchase intent questions at pre-defined price points.Product Stimulus:
A clear, consistent product concept shown to all respondents. For Gabor-Granger with competitive context, competitor products should also be clearly presented at fixed prices.Price Points (Gabor-Granger):
Typically 5–7 pre-selected price points spanning the expected range. Use the Van Westendorp acceptable range to inform selection.Sample Size:
Minimum 200 respondents for overall analysis. 300–500 preferred for stable demand curves and subgroup comparisons. Each subgroup needs adequate sample (at least 100) for reliable segment-level analysis.Currency and Format:
All prices should be in a single, clearly displayed currency. Use the same numeric format (e.g., £849, not “around 850 pounds”) across all materials.
Time Allocation
| Stage | Hours |
|---|---|
| Kick-off & planning | 2 |
| Analysis - overall | 10 |
| Analysis - per subgroup | 2 |
| Total (overall + 2 subgroups) | 16 hours |
Note: Add 2 hours per additional subgroup for analysis
Key Milestones (Analytics Perspective)
- Analytics Briefing: Initial project briefing with stakeholders to understand pricing objectives, product positioning, and competitive context
- Product Stimulus Review: Review of the product concept, competitor set, and price points to be tested in Gabor-Granger
- Questionnaire Review: Review and validation of Van Westendorp question wording, Gabor-Granger branching logic, and data quality checks
- Interim Data Provided: Preliminary data delivered for initial quality checks and validation
- Analytics Set Up Outputs: Output templates and analysis frameworks prepared and configured
- Final Data Provided: Complete dataset delivered with all quality checks passed
- Analytics Run Final Outputs: Final analysis executed — price sensitivity curves, demand curves, and revenue optimization completed
- Debrief Attended by Analytics (if necessary): Analytics team available for findings presentation and Q&A session
Questionnaire
Sample Size Calculations
Overall analysis:
Minimum 200 respondents. 300–500 preferred for stable results.Subgroup analysis:
At least 100 respondents per subgroup for reliable segment-level comparisons.Gabor-Granger note:
Each respondent only evaluates a subset of price points (due to branching), so larger samples improve coverage across all tested prices.
Van Westendorp Question Format
Van Westendorp uses four open-ended numeric price questions. The question order matters — start with the extremes (too expensive, too cheap) before asking about the middle range (expensive, bargain).
Example — EV Charging Unit (Pod Point):
A1. TOO EXPENSIVE
At what price would you consider the EV-Charging Unit to be
so expensive that you would not consider buying it?

£ [________________]


A2. TOO CHEAP
At what price would you consider the EV-Charging Unit to be
priced so low that you feel the quality couldn't be very good?

£ [________________]


A3. EXPENSIVE (STARTING TO HESITATE)
At what price would you consider the EV-Charging Unit as
starting to get expensive, where you would have to think
about buying it?

£ [________________]


A4. BARGAIN
At what price would you consider the EV-Charging Unit to be
a bargain — a great buy for the money?

£ [________________]
Data quality checks:
- Terminate if “Too Cheap” (A2) is higher than “Too Expensive” (A1) or “Expensive” (A3)
- Remove if any answer is £0 or an unrealistically high value (e.g., £2,000+)
- Remove if the same value is entered for all four questions
Gabor-Granger Question Format
Gabor-Granger uses sequential screens with branching logic. The respondent sees the product at a price point and indicates their purchase intent. Based on their answer, the price moves up or down.
Standard Format (No Competitive Context):
The product is shown alone at a single price point. The respondent gives a purchase intent rating, and the price adjusts based on their response.
SCREEN 1 (starting price randomly assigned):

Imagine you were looking to purchase a home EV charger.

┌─────────────────────────────────┐
│          Pod Point              │
│                                 │
│       [product concept]         │
│                                 │
│            £[PRICE]             │
└─────────────────────────────────┘

How likely would you be to purchase this product at this price?

○ Definitely would buy
○ Probably would buy
○ Might or might not buy
○ Probably would not buy
○ Definitely would not buy
Branching logic:
- If top-2 box (Definitely / Probably would buy) → show the next higher price point
- If bottom-3 box → show the next lower price point
- Exercise ends when no higher/lower price points remain
- Define the threshold before fieldwork — do not change the cutoff after seeing data
Pre-defined price points: £549, £649, £749, £849, £949, £1,049, £1,149
With Competitive Context (Pod Point Example):
The product is shown alongside competitors at fixed prices. Only the focal product’s price changes across screens. The respondent selects which product (if any) they would purchase.
SCREEN 1 (starting price randomly assigned):

Imagine you were looking to purchase a home EV charger.
Based on what you see below, which product would you purchase?

┌──────────────┬──────────────┬──────────────┐
│  Pod Point   │    Ohme      │  Myenergi    │
│              │              │              │
│  [concept]   │  [concept]   │  [concept]   │
│              │              │              │
│   £[PRICE]   │    £899      │   £1,099     │
├──────────────┼──────────────┼──────────────┤
│      ○       │      ○       │      ○       │
└──────────────┴──────────────┴──────────────┘
                              ○ None of these
Branching logic:
- If the focal product is selected → show the next higher price point
- If not selected → show the next lower price point
- Exercise ends when no higher/lower price points remain
Pre-defined price points: £849, £899, £949, £999, £1,049, £1,099, £1,149
Key Features and Considerations
Non-Negotiable Elements:
- ✅ Consistent product stimulus — the same concept shown to every respondent, with a “click to review” option for reference
- ✅ Clear currency formatting — prices displayed prominently with currency symbol
- ✅ Van Westendorp data quality checks — logical consistency validation built into the survey (too cheap < bargain < expensive < too expensive)
- ✅ Random starting price for Gabor-Granger — prevents systematic anchoring bias
- ✅ “None of these” option in Gabor-Granger — respondents must be able to reject all options at any price
- ✅ Van Westendorp runs before Gabor-Granger in the survey flow — avoids the closed-ended price points anchoring the open-ended responses
Optional Enhancements:
- Include competitor products at fixed prices in Gabor-Granger to add competitive context (as in the Pod Point example)
- Add a follow-up question asking respondents to explain their price expectations (“What made you choose that price?”)
- Run sensitivity analyses at different Gabor-Granger threshold definitions (e.g., “Definitely would buy” only vs. top-2 box)
- Include Newton-Miller-Smith extension to Van Westendorp for a more refined demand estimate from the PSM data
How They Work Together
The two methods are typically run sequentially in the same survey, each serving a distinct role:
| Van Westendorp | Gabor-Granger | |
|---|---|---|
| Role | Exploratory — map the acceptable price range | Confirmatory — find the revenue-maximizing price |
| Question type | Open-ended (respondent generates prices) | Closed-ended (researcher selects price points) |
| Output | Price corridor (PMC to PME) | Demand curve, revenue curve, optimal price |
| Runs first? | ✅ Yes — informs Gabor-Granger price selection | Runs second, using Van Westendorp range |
The recommended workflow:
- Run Van Westendorp to establish the acceptable price range (the “guardrails”)
- Use that range to select Gabor-Granger price points — typically 5–7 prices spanning the PMC-to-PME corridor and slightly beyond
- Run Gabor-Granger to measure demand elasticity within the range and identify the revenue-maximizing price
This combined approach provides both the perceptual framing (where the market thinks prices should be) and the behavioral data (what prices actually maximize revenue).
Van Westendorp — Price Sensitivity Curves
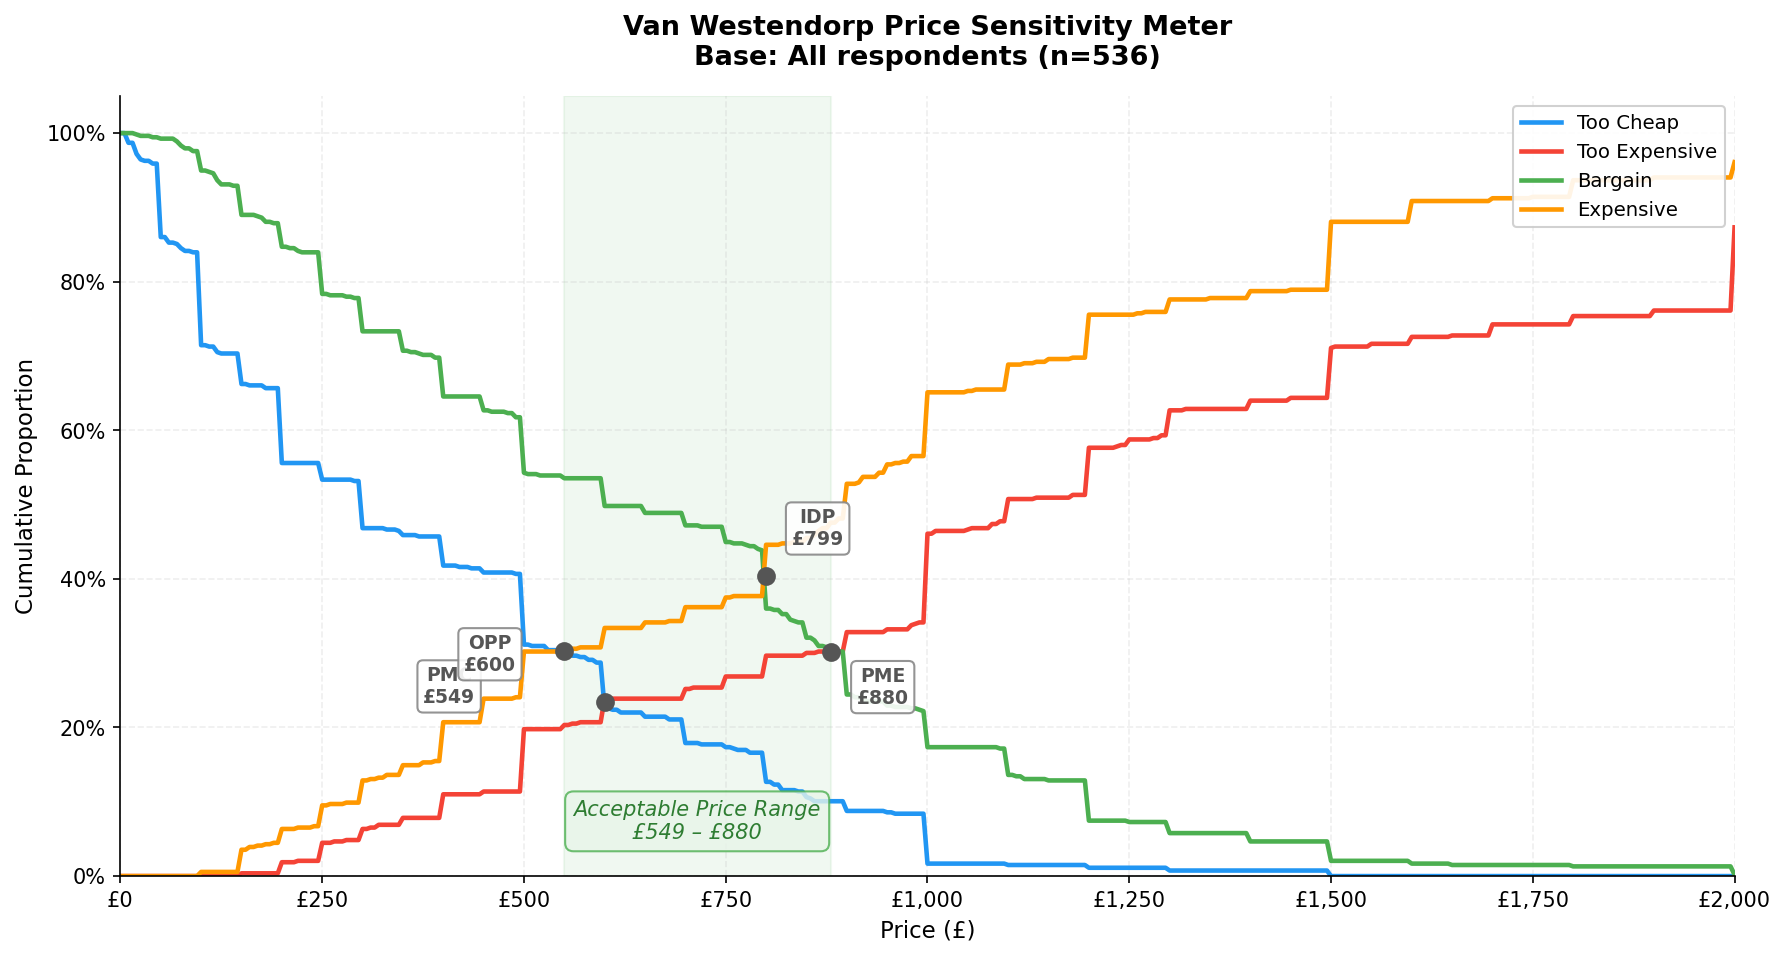
The four curves represent cumulative responses to each price question. Where they intersect defines the key price points: PMC (lower boundary), OPP (minimum resistance), IDP (market expectation), and PME (upper boundary). The shaded region is the acceptable price range — prices outside this corridor face significant consumer resistance.
Gabor-Granger — Demand & Revenue Curves (Standard Format)
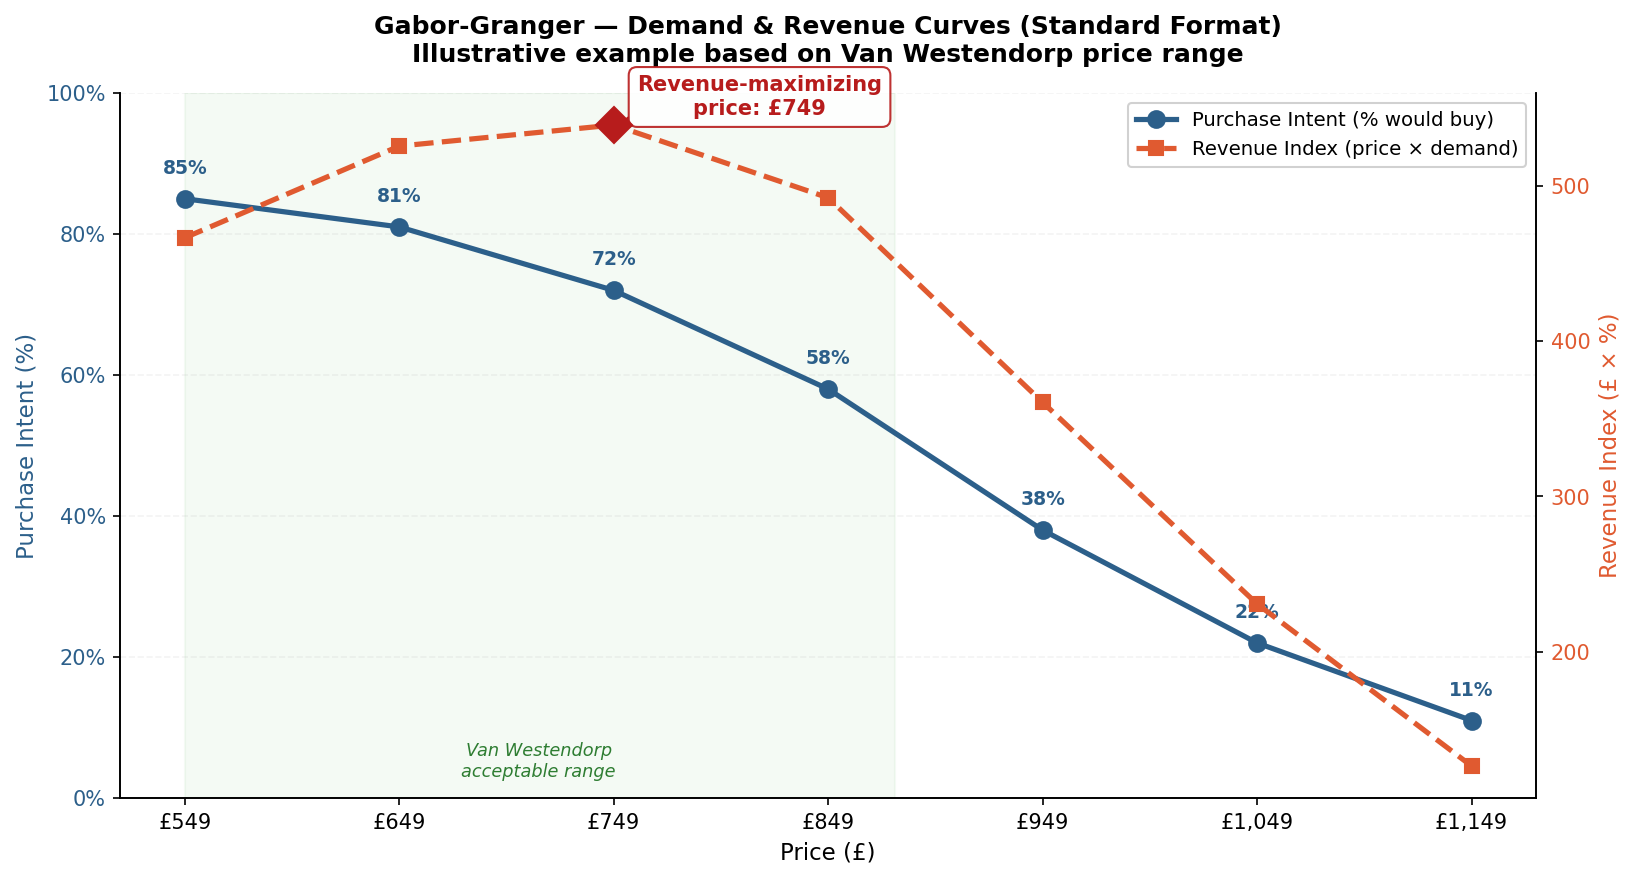
The standard Gabor-Granger output when the product is evaluated alone. The blue demand curve shows how purchase intent drops as price increases. The revenue curve (price × demand) captures the trade-off: higher prices bring more revenue per unit but fewer buyers. The peak of the revenue curve — here at £749 — is the price that maximizes total revenue.
Gabor-Granger — Demand Curve with Competitive Context
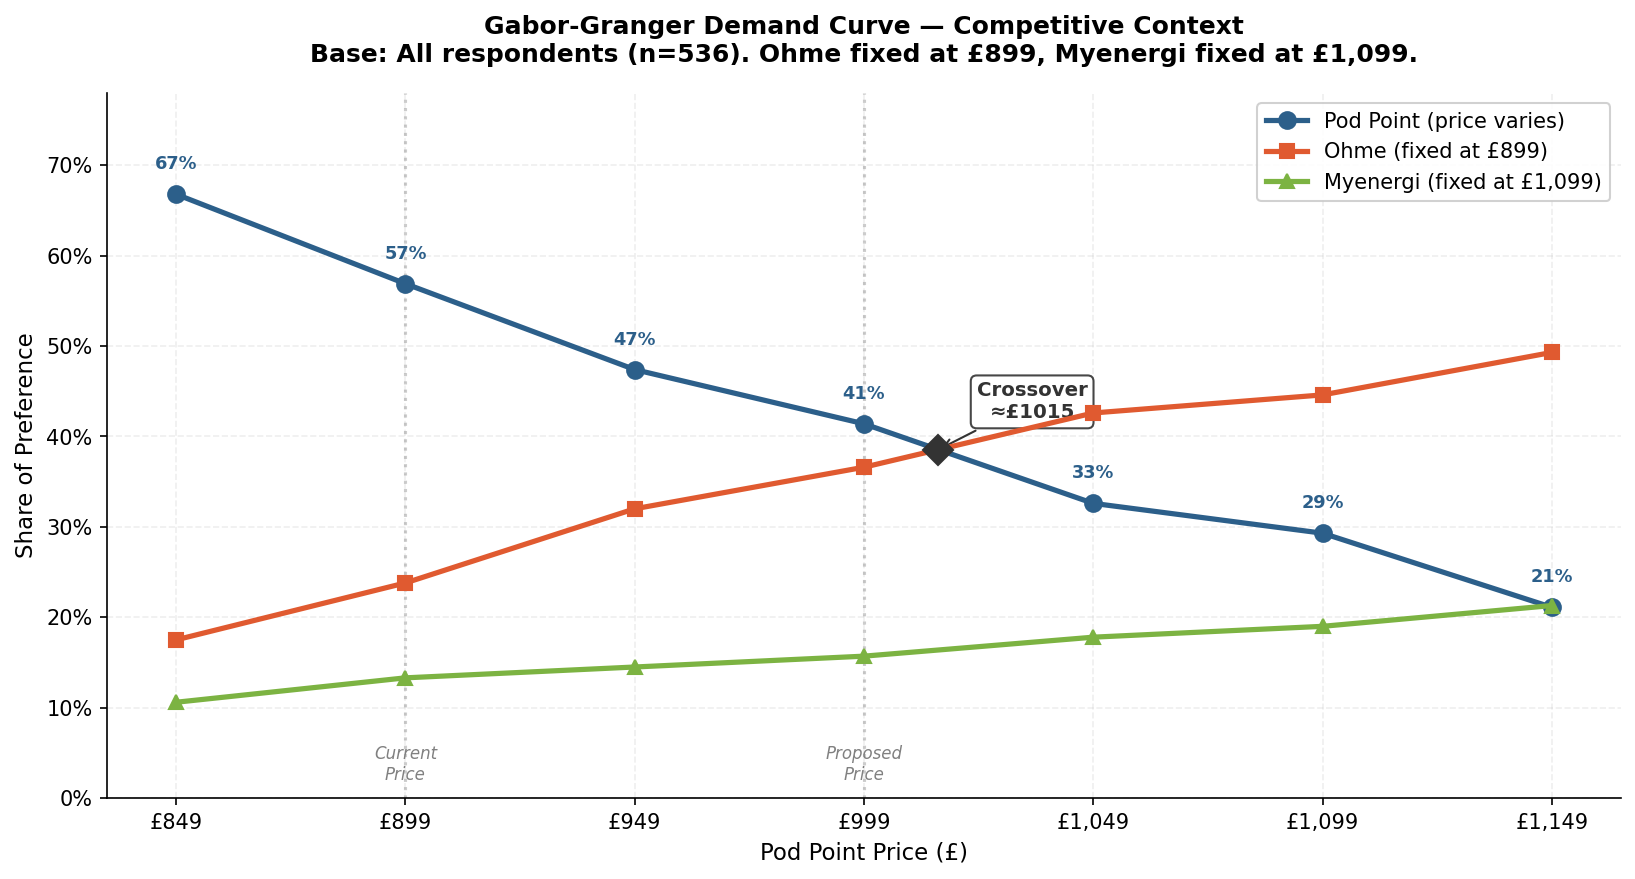
When competitors are included, the output shifts from purchase intent to share of preference. Each line tracks the share of respondents who would choose that brand at each price point. As Pod Point’s price increases, its demand drops while Ohme (the cheaper competitor) gains share. The crossover point (≈£1,015) marks where Pod Point loses its preference advantage.
Additional Output Types
Pricing analysis typically includes:
- Acceptable price range summary: The PMC-to-PME corridor with all four Van Westendorp intersection points
- Demand curve by segment: How price sensitivity differs across customer groups, markets, or demographics
- Revenue-maximizing price by segment: The optimal price point may differ by audience
- Competitive crossover point: The price at which the focal product loses majority preference to a competitor (Gabor-Granger with competitive context)
- Price elasticity summary: Directional assessment of how responsive demand is to price changes
Previous Project Examples
Project 1: Pod Point — Pricing Window (October 2024)
Academic Papers and Textbooks
Foundational Work
Van Westendorp, P. H. (1976).
NSS-Price Sensitivity Meter (PSM) — A New Approach to Study Consumer Perception of Price.
Proceedings of the 29th ESOMAR Congress, Venice.
– The original paper introducing the four-question price sensitivity method and the intersection-based analysis.Gabor, A., & Granger, C. W. J. (1966).
Price as an Indicator of Quality: Report on an Enquiry.
Economica.
– The foundational paper on sequential price testing. Clive Granger later won the 2003 Nobel Prize in Economics.
Extension
- Newton, D., Miller, J., & Smith, P. (1993).
A Market Acceptance Extension to Traditional Price Sensitivity Measurement.
Proceedings of the American Marketing Association Advanced Research Techniques Forum.
– Adds purchase intent questions to Van Westendorp, enabling demand curve and revenue estimation from PSM data.
Ready to use pricing research in your project? Contact the analytics team to discuss your requirements and next steps.
Email: Analytics@dtadvisorygroup.com
What to prepare for our discussion:
- The product or service being priced — concept description and current price (if applicable)
- Whether competitors should be included in the Gabor-Granger exercise, and if so, which competitors and at what prices
- Target audience definition and expected sample size
- Desired subgroup analyses (markets, segments, demographics)
- Whether this is a new product launch or a repricing of an existing product
- Decision timeline and budget parameters