Key Drivers Analysis
Statistical/Analytical Method
Key Drivers Analysis (KDA) is a broad analytical approach used to pinpoint what truly influences the key brand metrics, such as brand awareness, consideration, or loyalty. The analysis usually requires one or a few dependent questions (outcomes) and a series of independent questions (drivers) to work.
It isn’t one single model, but a toolkit of methods that look at how different drivers impact the brand outcome. The analytics team will determine which specific method to use based on the research objective, data structure, and underlying hypotheses—ensuring the analysis balances clarity, rigor, and practical relevance for the research question at hand.
Example approaches: regression, machine learning, and Bayesian methods — the analytics team selects the right approach for each project.
Problem It Solves
Whether it’s a simple statistical model or a more advanced machine learning approach, every KDA has the same goal: to help marketers cut through complexity to identify which attributes of the brand or experience most directly drive business outcomes.
While many drivers move together, such as brand exposure, brand perceptions, or product attributes, KDA isolates which ones truly influence the key outcomes, helping teams prioritize what to strengthen, fix, or invest in for maximum impact.
Key Assumptions
For KDA to produce valid and actionable insights, several conditions should generally hold:
- The outcome metric reflects a single, well-defined objective, such as customer satisfaction, brand preference, etc.
- The potential drivers represent meaningful aspects of the consumer’s behavior or attitudes.
- The relationships between drivers and outcomes are stable and interpretable within the marketing context.
Business Questions This Answers
KDA helps answer questions about what truly moves marketing performance. It’s most valuable when teams need to separate what matters most from what merely correlates. Common use cases include:
- Which brand attributes most drive brand consideration?
- Which parts of the marketing campaign are driving purchasing intent?
- Which parts of the customer buying journey have the biggest impact on brand satisfaction or brand preference?
- Where should we focus improvement efforts to elevate overall brand health or conversion?
In short, KDA turns long lists of metrics or survey attributes into a clear, prioritized view of the levers that drive marketing outcomes.
When NOT to Use
It’s less suitable when:
- The key outcome metric isn’t clearly defined or measured consistently
- Drivers are mostly qualitative or lack variation
- The client needs pure prediction rather than understanding what drives the outcomes
Data Requirements
- Data Type: Survey data capturing both a dependent variable (e.g., customer satisfaction, purchase intent) and multiple potential drivers (e.g., brand perceptions, customer experiences)
- Structure: Continuous or categorical variables are both acceptable; the analytics team will select the right modeling approach for the data shape and sample size
- Sample Size: Ideally several hundred observations or more; enough to capture meaningful variation across drivers
- Question design: Drivers should be distinct, interpretable, and linked logically to the outcome metrics
Time Allocation
| Stage | Hours |
|---|---|
| Kick-off & planning | 2 |
| Questionnaire design | 2 |
| Analysis - overall | 8 |
| Analysis - per subgroup | 2 |
| Total (overall + 2 subgroups) | 16 hours |
Note: Add 2 hours per additional subgroup for analysis
Key Milestones (Analytics Perspective)
- Analytics Briefing: Initial project briefing with stakeholders to understand objectives and feature requirements
- Questionnaire Review: Review and validation of questionnaire design, feature definitions, and survey logic
- Interim Data Provided: Preliminary data delivered for initial quality checks and validation
- Analytics Set Up Outputs: Output templates and analysis frameworks prepared and configured
- Final Data Provided: Complete dataset delivered with all quality checks passed
- Analytics Run Final Outputs: Final analysis executed, categorizations completed, and outputs generated
- Debrief Attended by Analytics (if necessary): Analytics team available for findings presentation and Q&A session
Questionnaire
Sample Size Calculations
- Overall analysis: Minimum 100 respondents. If you are doing subgroup analysis you need enough to satisfy the subgroup requirements as well.
- Subgroup analysis: Minimum 100 respondents per subgroup. A good rule of thumb is to have at least 15 observations per driver variable for stable estimates (e.g. 10 drivers would require 150 respondents, 5 drivers would require 75 respondents).
- More complex models (e.g., tree-based or regularized regressions) typically require larger samples to detect patterns reliably, while simpler regression models can perform well with fewer observations if drivers are limited.
- Data sufficiency: Too few responses can lead to unstable driver importance rankings, inflated effects, or low confidence in recommendations. It’s better to have fewer, high-quality variables than to overfit a small dataset.
Example Question Structure
In a Key Drivers Analysis (KDA) survey, you generally collect two types of variables:
Outcome variables (dependents) → the “what we’re trying to explain” (e.g., brand satisfaction, brand preference, purchase intent).
Driver variables (independents) → the “potential reasons why” outcomes differ across respondents (e.g., brand perceptions, shopping experiences, feature evaluations, or brand associations).
KDA can work with many types of survey variables—as long as they measure distinct aspects of the brand, product, or experience that could plausibly influence the key outcome (e.g., satisfaction, intent, loyalty). Here are examples by question type:
- Rating Scale Used for attitudes, perceptions, or satisfaction metrics. These are the most common inputs for KDA.
“How would you rate your overall satisfaction with [Brand/Product]?” (1 = Very dissatisfied, 10 = Very satisfied)

“To what extent do you agree that [Brand] offers good value for money?” (Strongly disagree → Strongly agree)

“How innovative do you consider [Brand/Product] to be?” (Not at all innovative → Extremely innovative)- Categorical Choice Useful for preference or awareness variables.
“Which of the following brands do you currently use most often?” (Brand A / Brand B / Brand C / None)

“Which campaign message do you recall seeing recently?” (List of slogans or visuals)

“Which product feature matters most when choosing [category]?” (Price / Design / Quality / Sustainability)- Binary (Yes/No or Presence/Absence) Ideal for feature possession, exposure, or behavioral indicators.
“Have you seen any advertising from [Brand] in the past month?” (Yes / No)

“Do you currently subscribe to [Service]?” (Yes / No)

“Would you consider buying [Product] again?” (Yes / No)- Bi-polar Differential Captures nuanced brand personality or positioning perceptions.
“Please rate [Brand] on the following scales:”

-   Traditional ⟶ Modern
-   Unreliable ⟶ Reliable
-   Boring ⟶ Exciting

(Each on a 5- or 7-point scale)
Here is a full survey example:
Survey Objective
PlayStation wants to understand how consumer perceptions of console brands and retail experiences influence purchase decisions when shopping for gaming consoles and accessories. Insights from this study will identify the key drivers that most impact purchase intent and guide both brand and retail strategies.1. Introduction
Thank you for taking part in this survey about gaming consoles and shopping experiences. Your feedback will help us understand what matters most to consumers when deciding where and what to buy. The survey will take about 10 minutes, and all answers are confidential.2. Outcome (Dependent) Questions
Q1. How likely are you to purchase a **PlayStation console** in the next 12 months?
- 0 = Not at all likely
- 10 = Extremely likely

Q2. Overall, how satisfied are you with your most recent experience shopping for gaming consoles or accessories?
- 1 = Very dissatisfied
- 10 = Very satisfied
3. Driver (Independent) Questions
Q3. How much do you agree or disagree with each statement about PlayStation?
(5-point scale: Strongly disagree → Strongly agree)
- PlayStation offers the best gaming performance.
- PlayStation is innovative and future-focused.
- PlayStation provides good value for money.
- PlayStation is easy to find at major retailers.
- PlayStation is a brand I trust.

Q4. Thinking about the retailer where you last shopped for gaming consoles or accessories, how would you rate each aspect?
(5-point scale: Very poor → Excellent)
- Availability of PlayStation products
- Ease of finding information or comparing consoles
- Helpfulness and knowledge of store staff
- In-store or online checkout convenience
- Attractiveness of product displays

Q5. How appealing do you find PlayStation’s recent promotions or marketing when shopping for gaming products?
- 1 = Not at all appealing
- 10 = Extremely appealing

Q6. Where do you usually make your final purchase decision for gaming consoles or accessories?
- [ ] In-store after seeing displays or demos
- [ ] Online after reading reviews
- [ ] Based on promotions or deals
- [ ] After recommendations from friends or influencers
The KDA will model how each driver relates to purchase intent and satisfaction to reveal the factors that most influence in-store decision-making.
Key Features and Considerations
Non-Negotiable Elements:
- ✅ Clear objective defining one or two primary outcome metrics (e.g., purchase intent, satisfaction)
- ✅ Logical flow — begin with context and outcome questions before introducing potential drivers
- ✅ Distinct driver statements that measure unique perceptions, experiences, or brand attributes
- ✅ Consistent scale formats (e.g., 1–5 or 0–10) across all rating items
- ✅ Single concept per question — avoid multi-part or double-barreled wording
- ✅ Pilot test with 50–100 completes to verify comprehension, variance, and timing
Optional Enhancements:
- Randomize driver question order within thematic blocks to minimize priming effects
- Include attention checks in surveys longer than 10 minutes
- Add open-ended questions to surface unprompted drivers for qualitative coding
- Use visual scales or sliders for better mobile engagement
- Pre-test scale anchors (e.g., “Extremely likely” vs. “Definitely will”) for clarity and consistency
Driver Definition Quality:
| ❌ Poor Driver Statement | ✅ Improved Driver Statement |
|---|---|
| “Good service” | “Store staff are knowledgeable about gaming consoles” |
| “Brand perception” | “PlayStation is a brand I can trust” |
| “High quality” | “PlayStation consoles are durable and well-built” |
| “Easy purchase” | “It was easy to find and buy PlayStation products in-store” |
| “Good promotions” | “PlayStation offers attractive retail bundles or deals” |
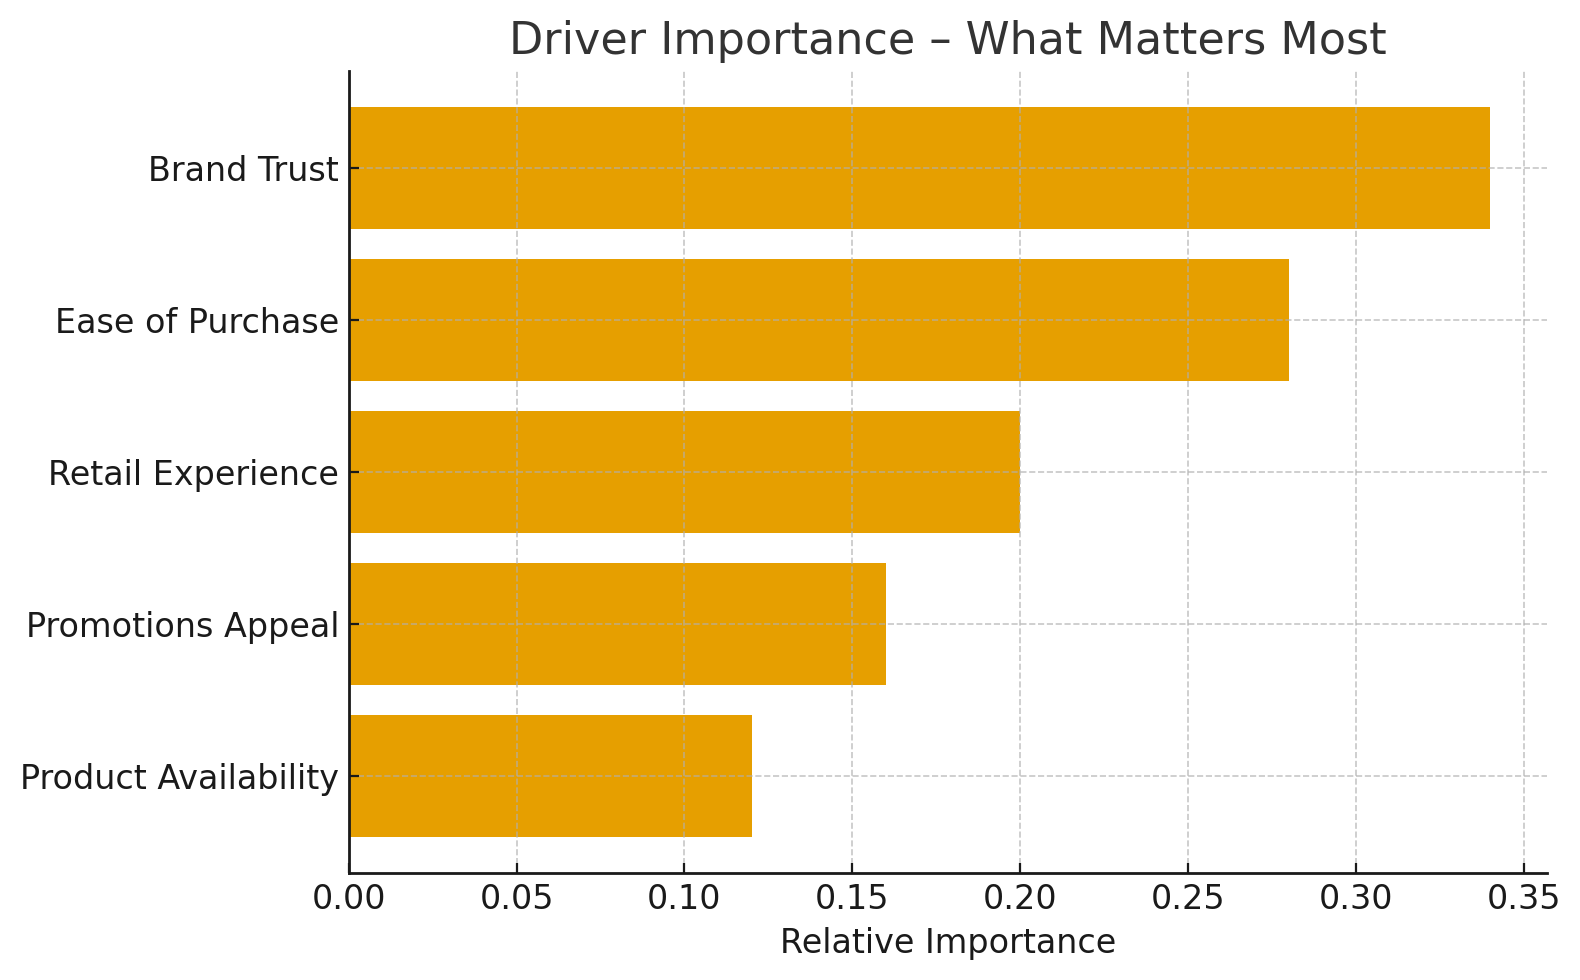
A ranked view of which drivers have the largest impact on the target (e.g., purchase intent). Ideal as the headline KDA slide. Longer bars = bigger influence. The direction indicates whether increasing a driver raises or lowers the outcome.
Previous Project Examples
Project 1: PlayStation Shopper Insights Refresh
Project 2: PlayStation - PlayStation Live Service Tracker
Academic Papers and Textbooks
Core Statistical Foundations
Hair, J. F. et al. (2019). Multivariate Data Analysis (8th ed.).
– Core text for regression, multicollinearity, and factor structure — the backbone of KDA.James, G. et al. (2021). An Introduction to Statistical Learning (2nd ed.).
– Clear guide to regression, LASSO, and tree-based models used in modern driver analysis.
Marketing Analytics & Applications
Lilien, G. L., Rangaswamy, A., & De Bruyn, A. (2017). Principles of Marketing Engineering and Analytics (3rd ed.).
– Bridges statistical modeling and marketing decision-making; directly relevant for explaining KDA to clients.Anderson, E. W., Fornell, C., & Lehmann, D. R. (1994).
Customer Satisfaction, Market Share, and Profitability. Journal of Marketing.
– Classic example of linking satisfaction drivers to business outcomes — the essence of KDA.
Ready to use this technique in your project? Contact the analytics team to discuss your requirements and next steps.
Email: Analytics@dtadvisorygroup.com
What to prepare for our discussion:
- The key outcome metric you want to explain (e.g., purchase intent, satisfaction, loyalty)
- A list of potential drivers or the survey questionnaire with driver questions
- Target audience definition and expected sample size
- Desired subgroup analyses (markets, segments, demographics)
- Decision timeline and project context